
Whitby vs. Caledon: A 2026 Strategic Analysis of GTA Price Growth
This market analysis breaks down the price mechanics between Whitby and Caledon for clients currently in the "Squeezed" phase of the Here to Home Method.
Nineteen years in the GTA has taught me that these two markets operate on different "gravitational" pulls. While Whitby is driven by logistics and transit accessibility for the workforce, Caledon is driven by luxury inventory and lot value.
Market Mechanics: Whitby vs. Caledon
Whitby (Durham): The Stabilizer.
Price Ceiling: Whitby remains more accessible for the condo-to-house transition. It lacks the extreme luxury peaks of Caledon, which makes its price floor more resilient during interest rate volatility.
Strategic Benefit: The lower barrier to entry allows upsizers to retain more liquid equity while securing a detached asset.
Caledon (Peel): The High-Beta Market.
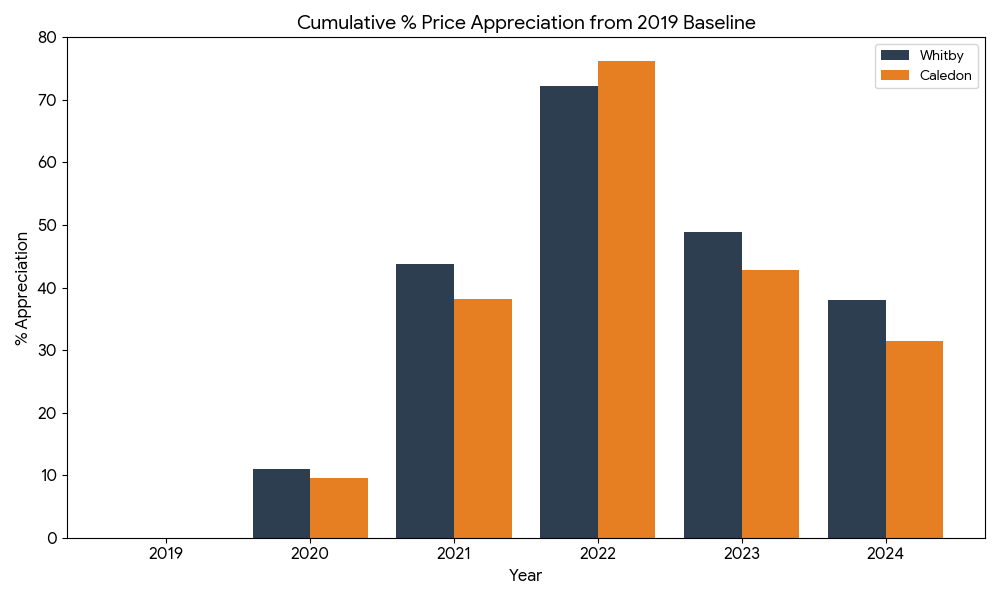
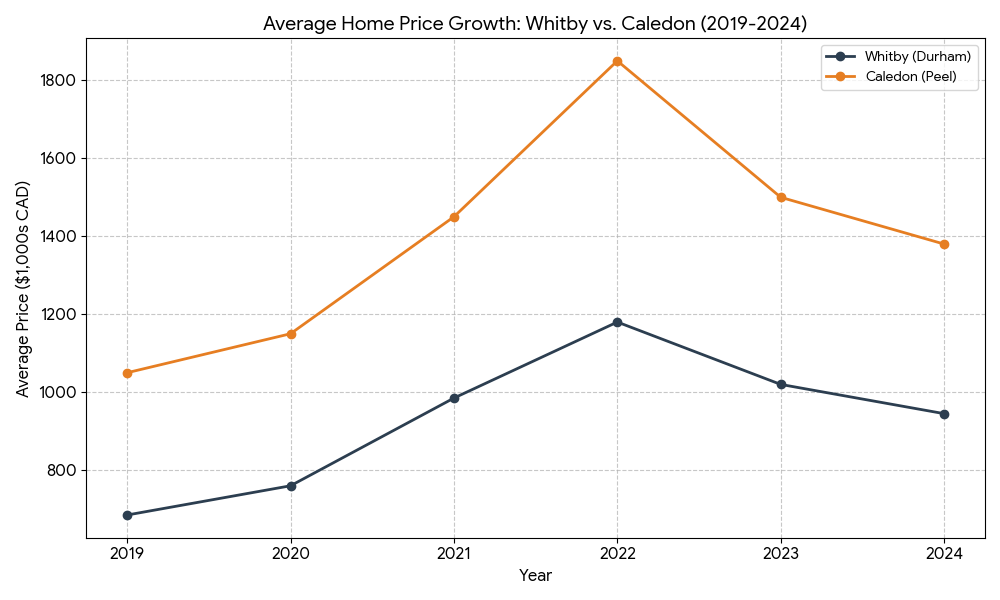
Volatility: As the charts show, Caledon experienced a more aggressive peak in 2022 followed by a sharper correction. This is typical for markets with high-value detached stock.
Strategic Benefit: For those seeking long-term land value and "architectural edge," Caledon offers a superior lot-to-structure ratio, though it requires a higher risk tolerance for short-term equity swings.
The "So What?" for Upsizers
Having navigated the 2008 and 2017 market shifts, I view the current price spread as a strategic window.
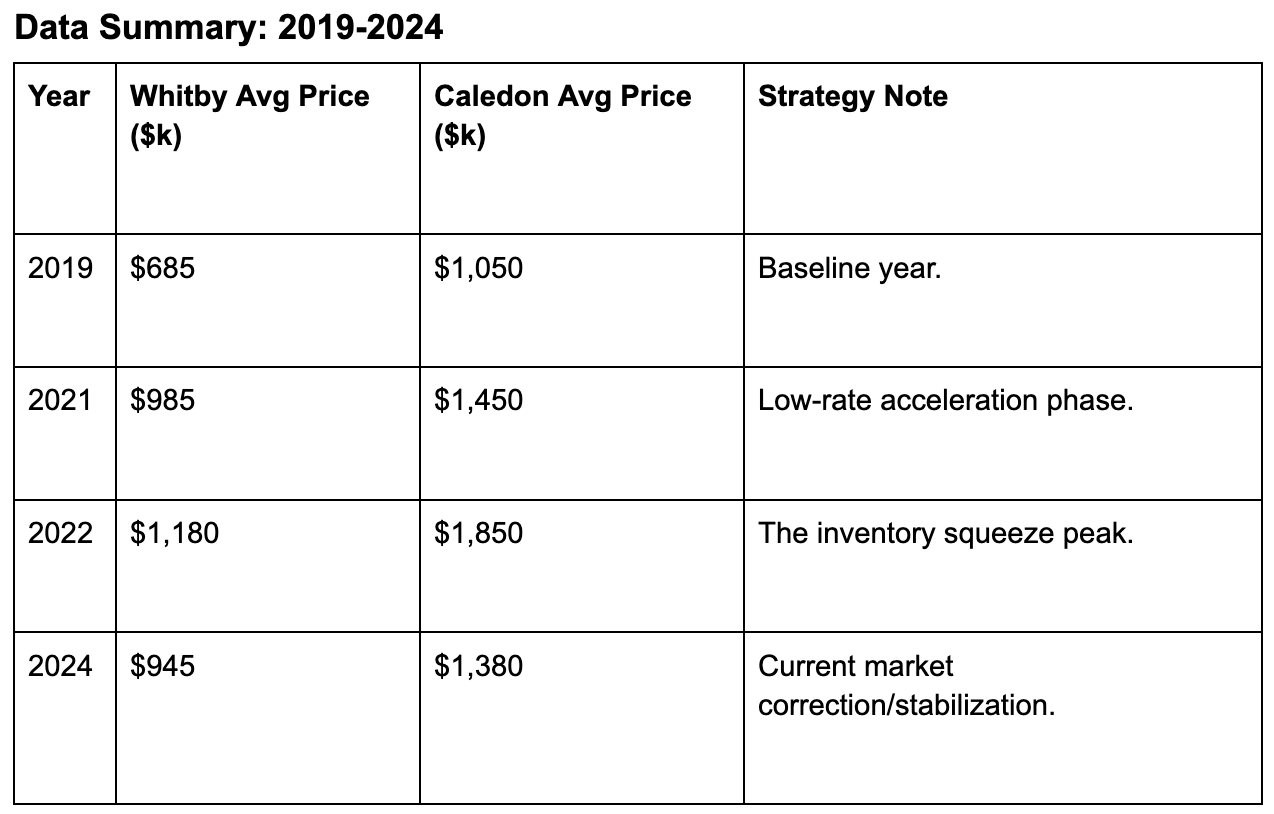
Inventory Absorption: Whitby’s inventory is moving faster due to its mid-range price point ($850k–$1.1M). If you are looking for a quick transition with predictable resale, this is the target.
Equity Leverage: Caledon’s recent price correction (as seen in the 2023-2024 data) represents a "reset." For a condo owner with significant equity, this is the time to leverage that into a larger lot before the next rate cycle triggers another peak.
The move from "Squeezed" to "Space" is a logistics problem. We are monitoring the rate cycle to determine the best leverage for your timing.
Next Step: Review your current condo equity against the Whitby/Caledon price floors to determine your maximum borrowing power.
Charts and data are based on TRREB historical averages and regional market reports.