GTA Real Estate Market Update – May 2026 | Q Real Estate Group
GTA Real Estate Market Update — May 2026
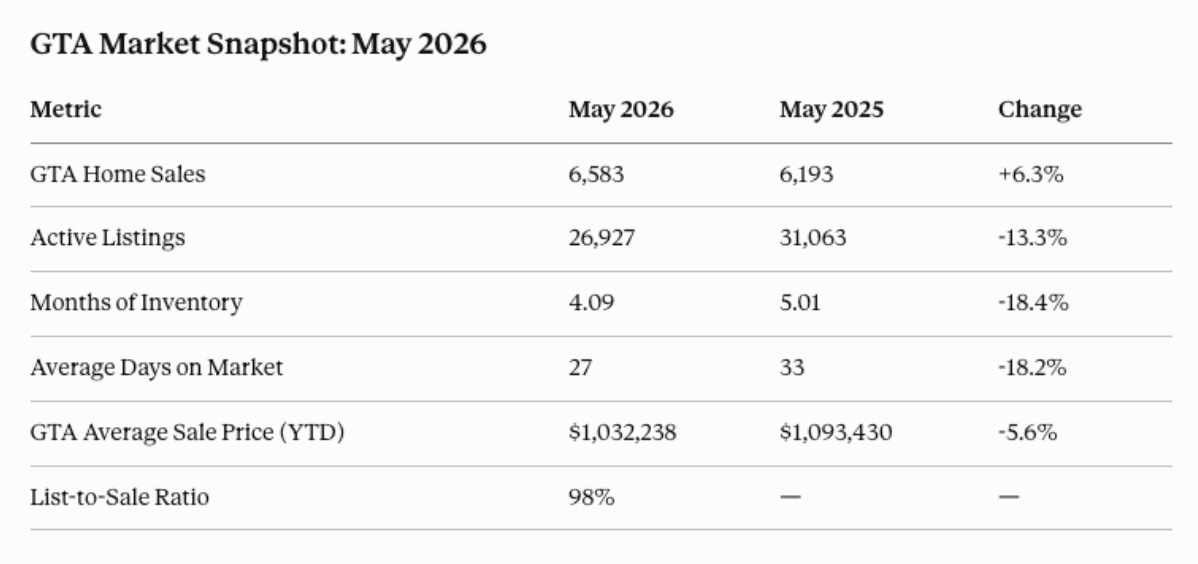
The short version: GTA home sales rose 6.3% year over year in May 2026, active listings fell 13.3%, and homes are selling faster — averaging 27 days on market versus 33 a year ago. Prices remain below prior-year levels in most areas, with the GTA year-to-date average at $1,032,238 (down 5.6%). The market is tightening, but buyers still have more room than they did in 2021–2023.
Source: TRREB Market Watch, May 2026 | Published by Q Real Estate Group
What's Driving the Shift
After several quarters of softness, the GTA market is showing measurable improvement across three key indicators: rising sales, shrinking inventory, and faster transaction timelines.
Sales are up. 6,583 transactions closed in May — a 6.3% increase from May 2025 — marking the third consecutive month of year-over-year gains.
Inventory is contracting. Active listings dropped to 26,927, down 13.3% from a year ago. Months of inventory fell to 4.09, from 5.01 in May 2025. A reading below 4 months typically indicates a seller's market; the GTA is approaching that threshold.
Homes are moving faster. Average days on market came in at 27 in May 2026, down from 33 a year ago — a 18.2% improvement that reflects stronger buyer engagement across most property types.
Prices are still below peak, but stabilizing. The GTA average sale price YTD of $1,032,238 is down 5.6% versus last year. Month-over-month, however, the trajectory has been improving steadily since January 2026.
May 2026 Market Performance by Area
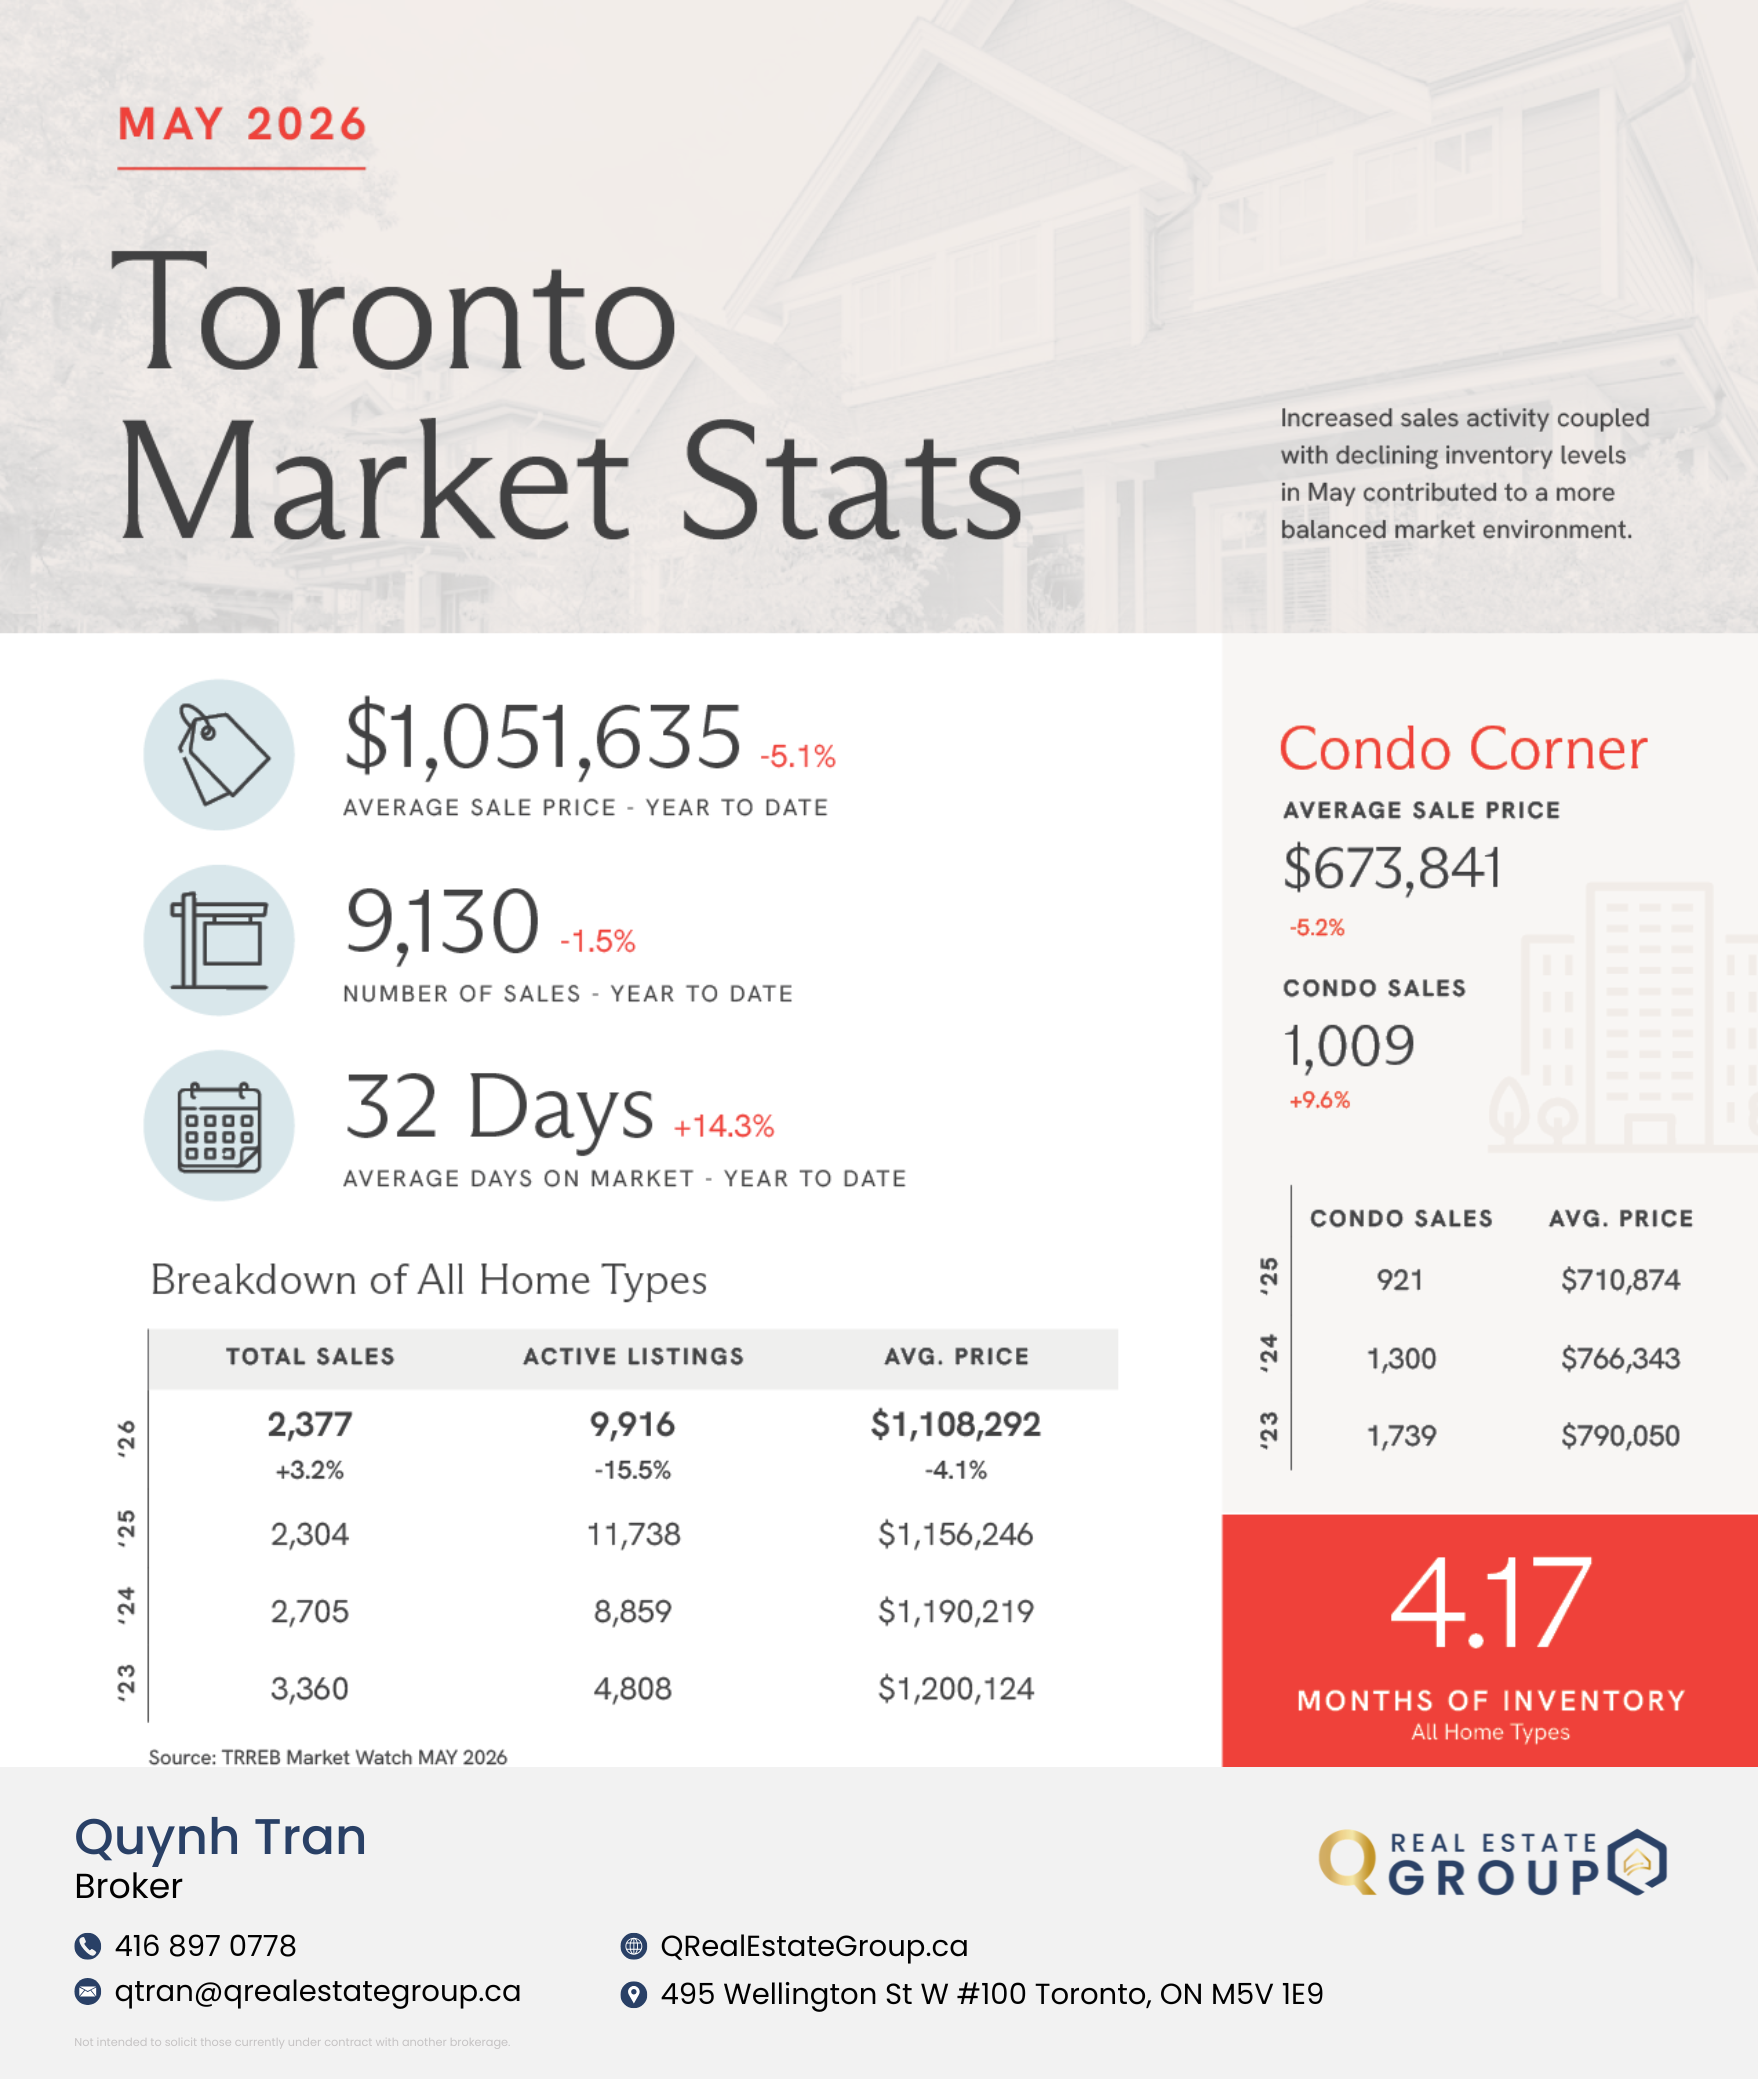
Toronto
YTD average sale price: $1,051,635 (down 5.1% year over year)
May sales up 3.2% versus last year
Active listings fell 15.5% — one of the sharpest inventory contractions in the region
Condo market: 1,009 sales in May at an average price of $673,841
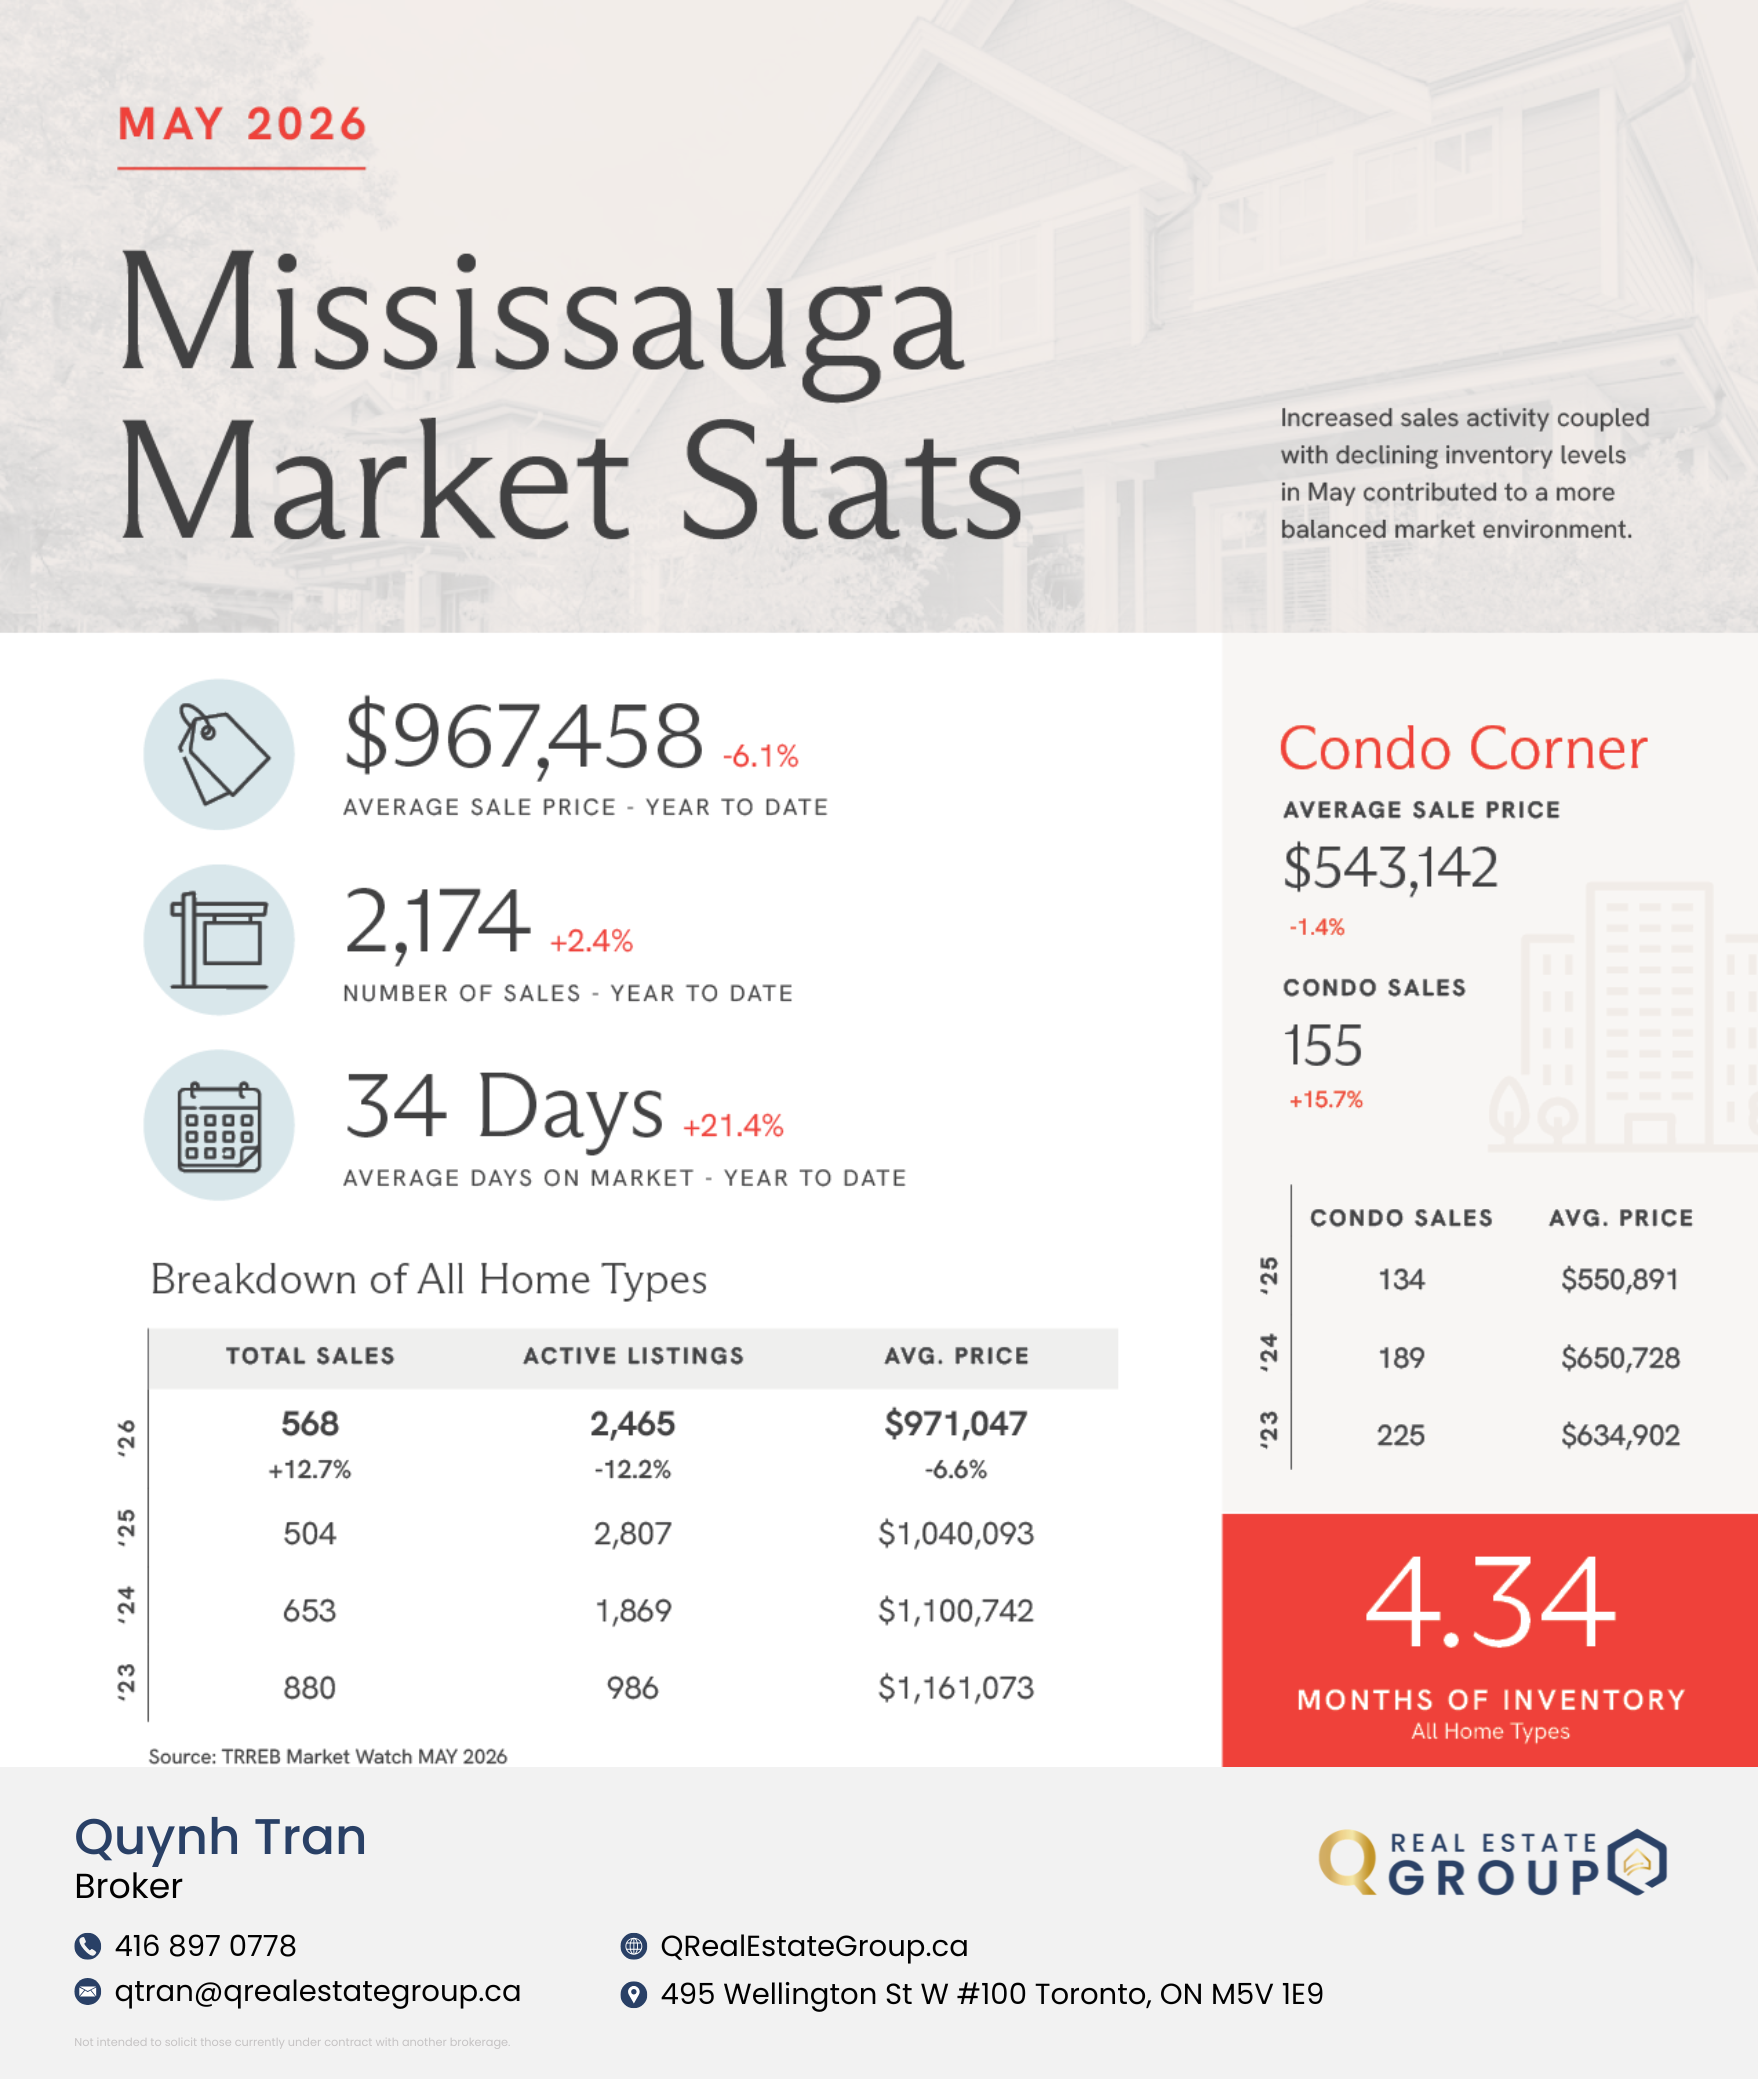
Mississauga
YTD average sale price: $967,458 (down 6.1%)
Sales jumped 12.7% in May year over year
Inventory down 12.2%
Condo activity: 155 sales in May, up 15.7% year over year
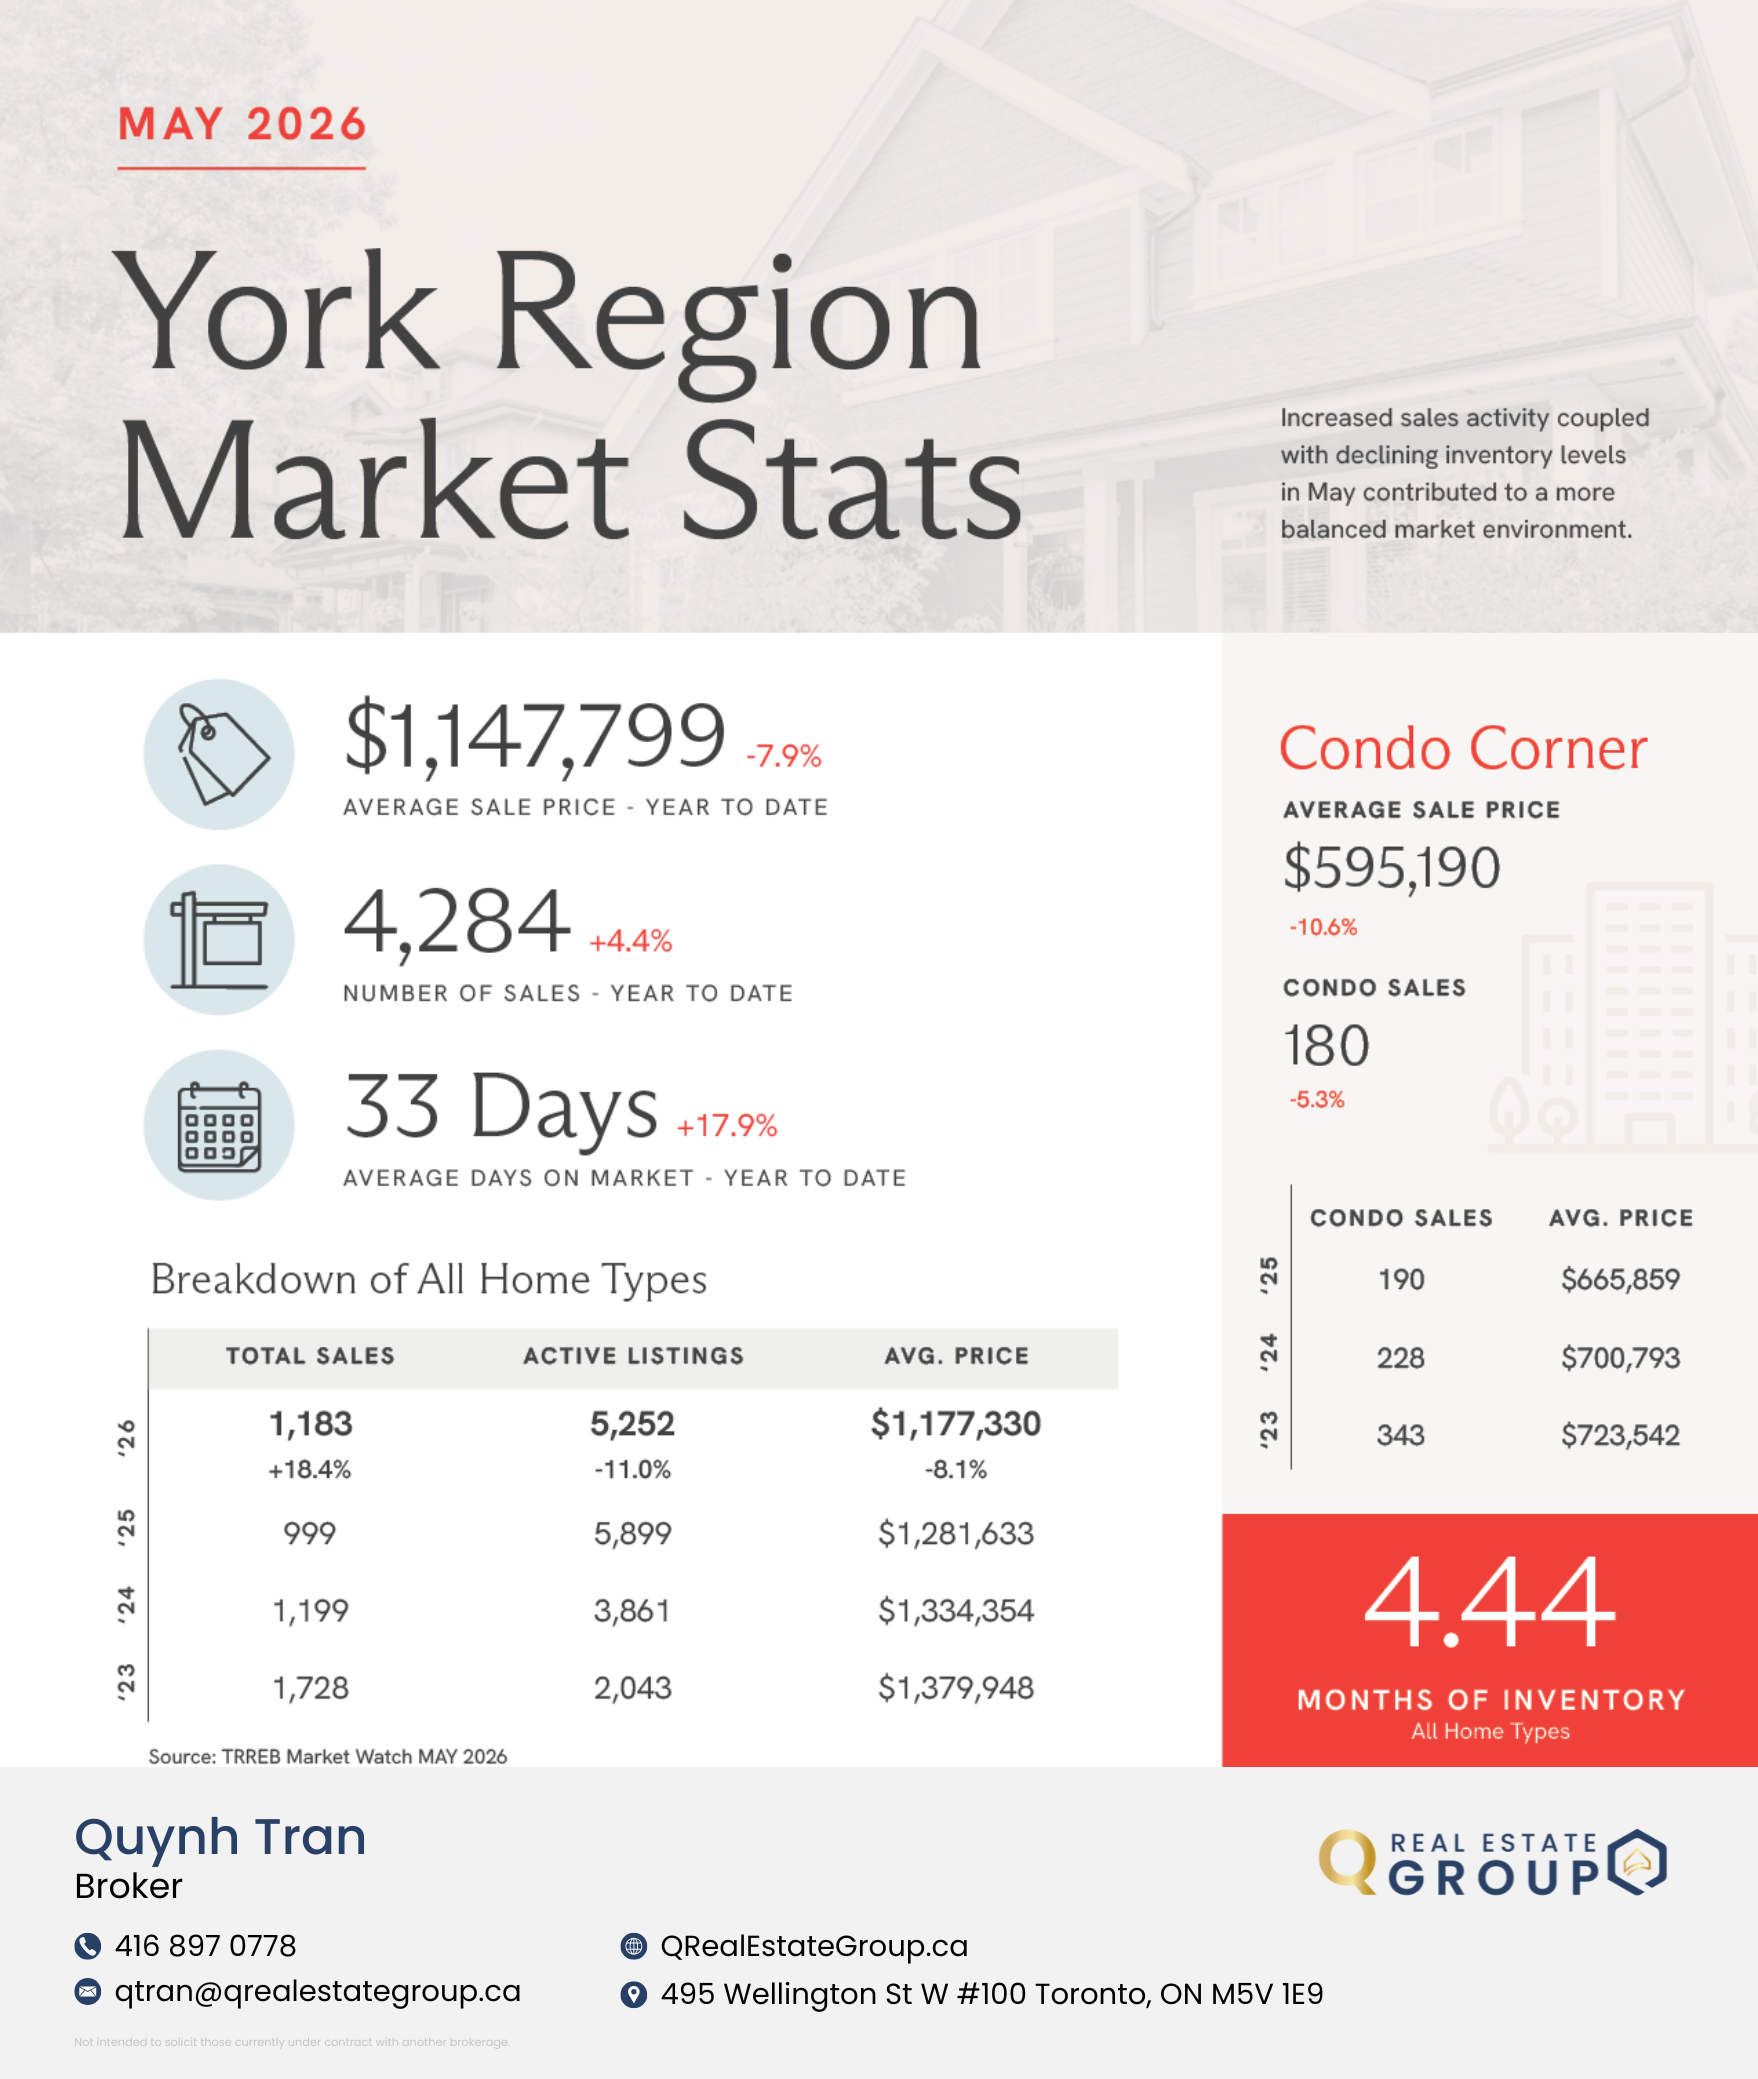
York Region
YTD average sale price: $1,147,799 (down 7.9%)
Sales surged 18.4% in May — the strongest year-over-year gain across major GTA markets
Active listings fell 11.0%
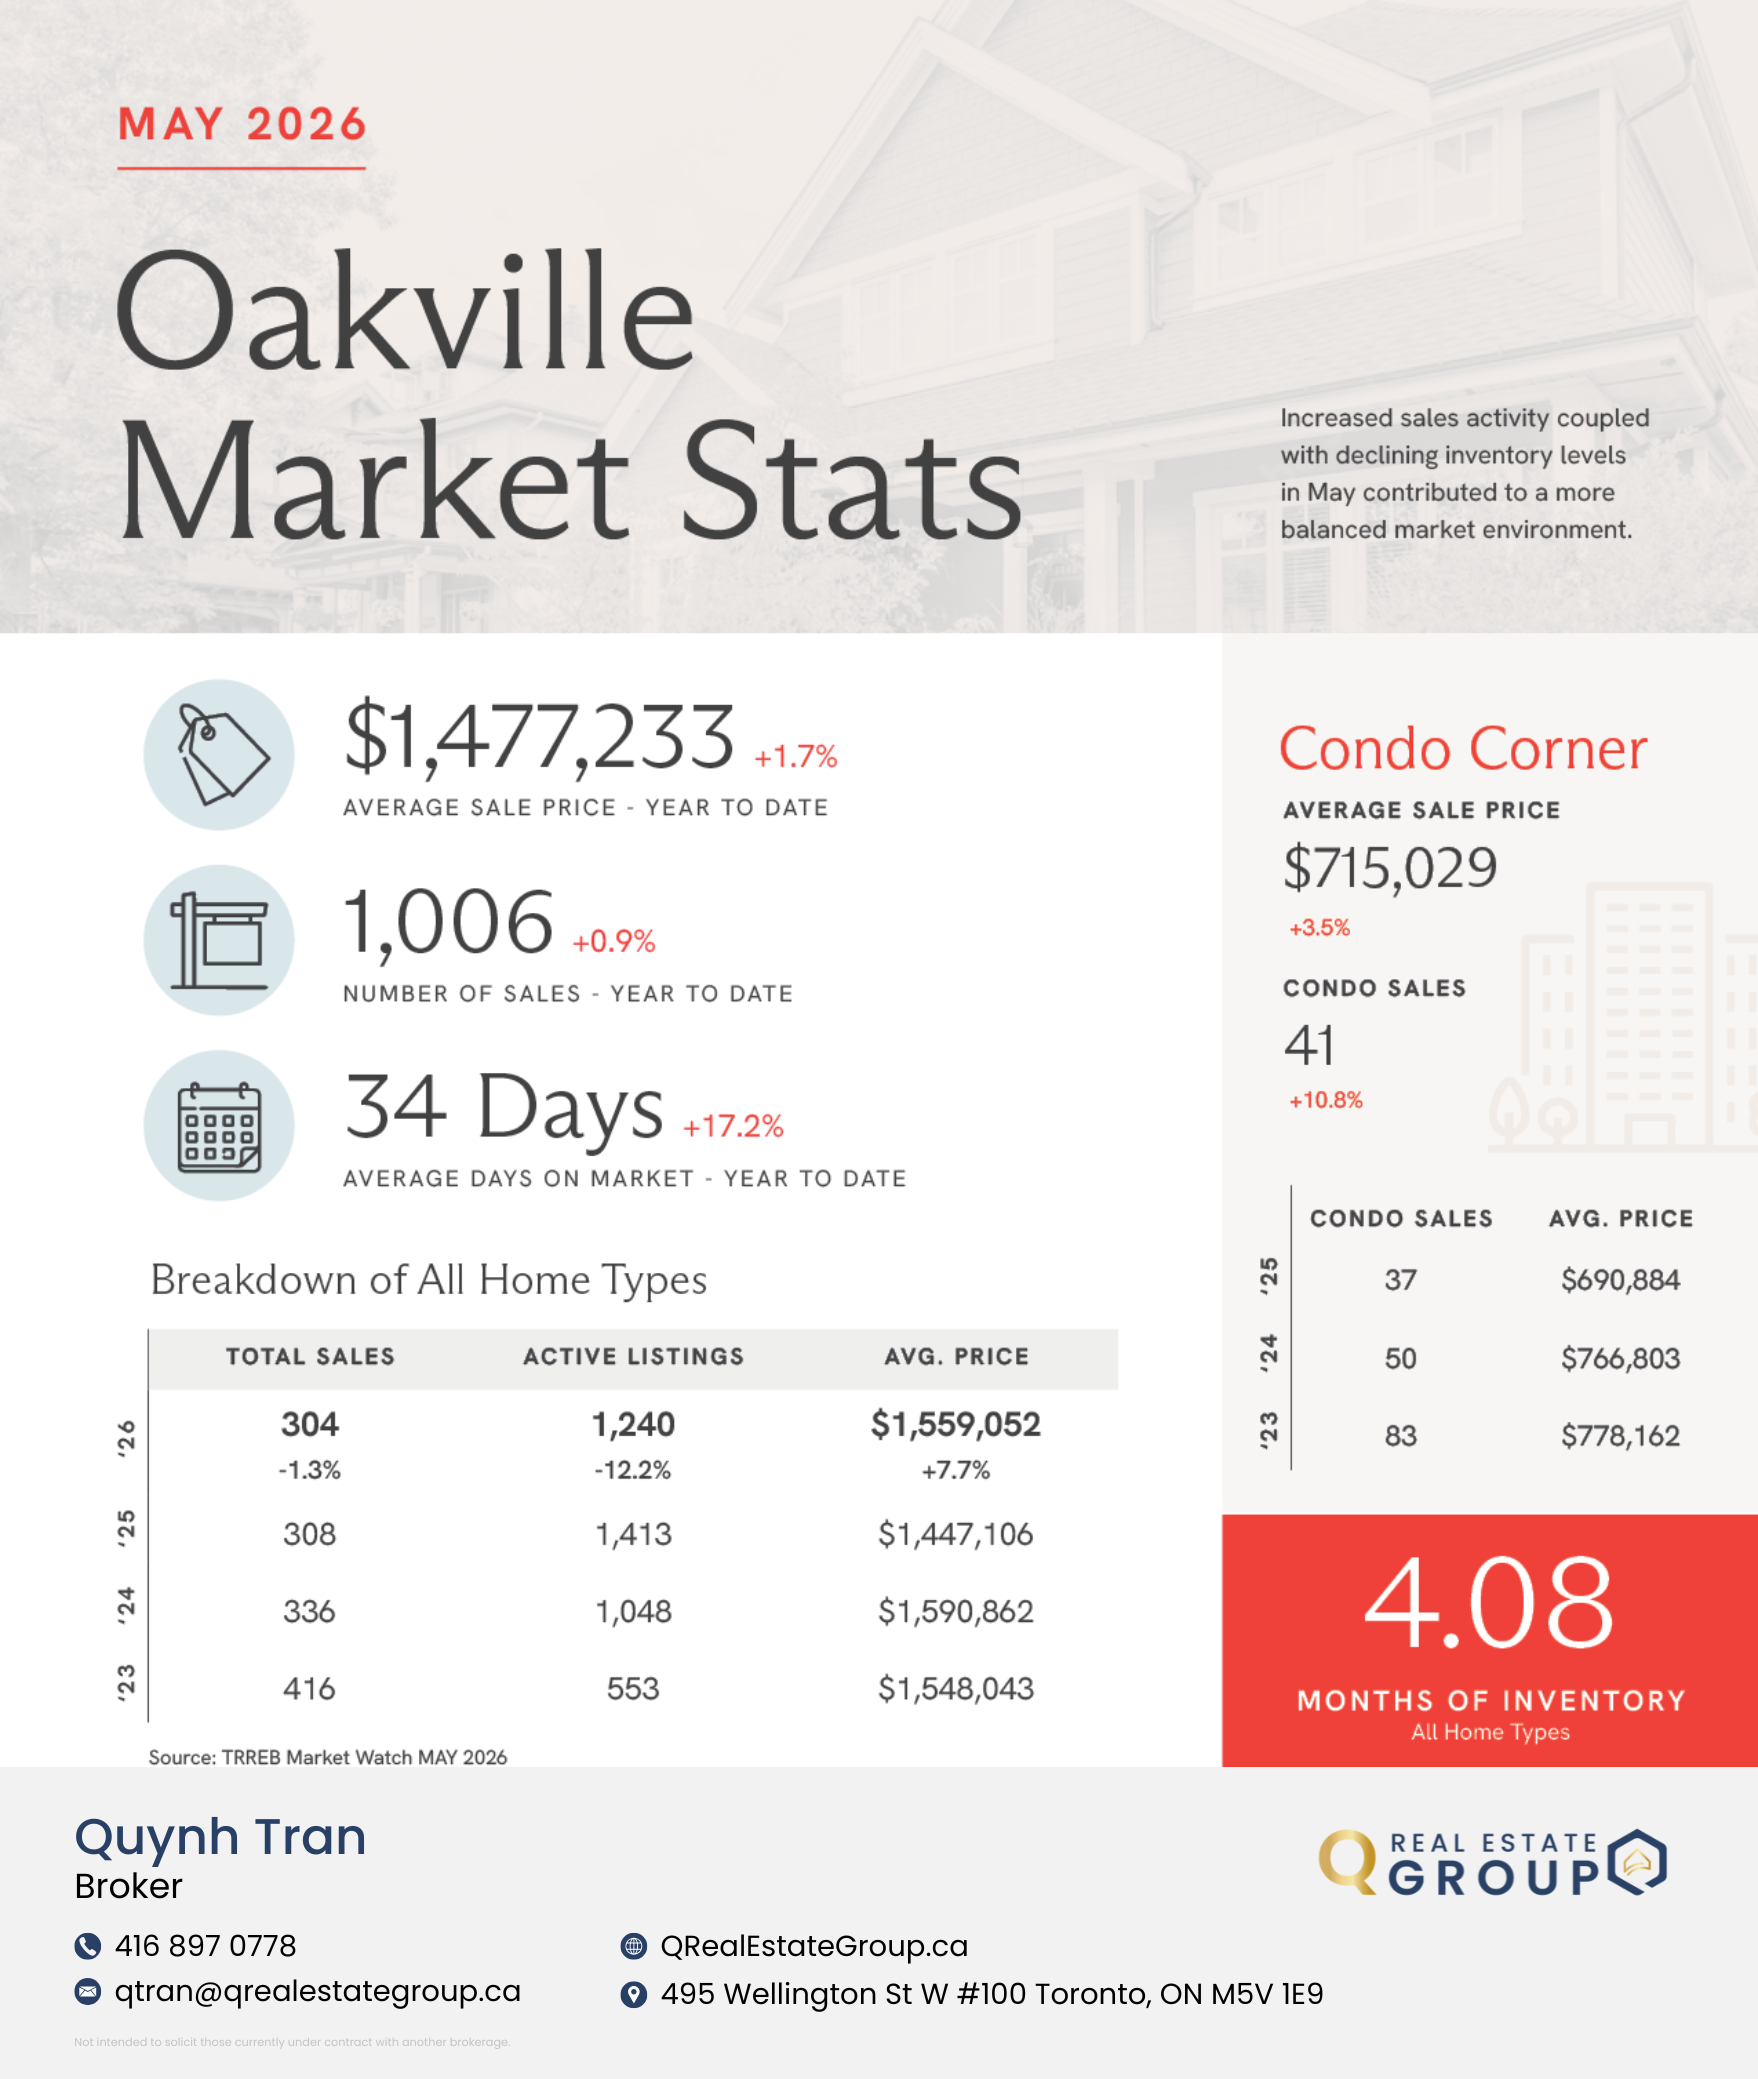
Oakville
YTD average sale price: $1,477,233 — up 1.7% year over year
One of the only GTA markets in positive price territory in 2026
May average sale price: $1,559,052, up 7.7% from May 2025
Inventory down 12.2%
Condo segment: 41 sales at an average of $715,029 (up 3.5% year over year)
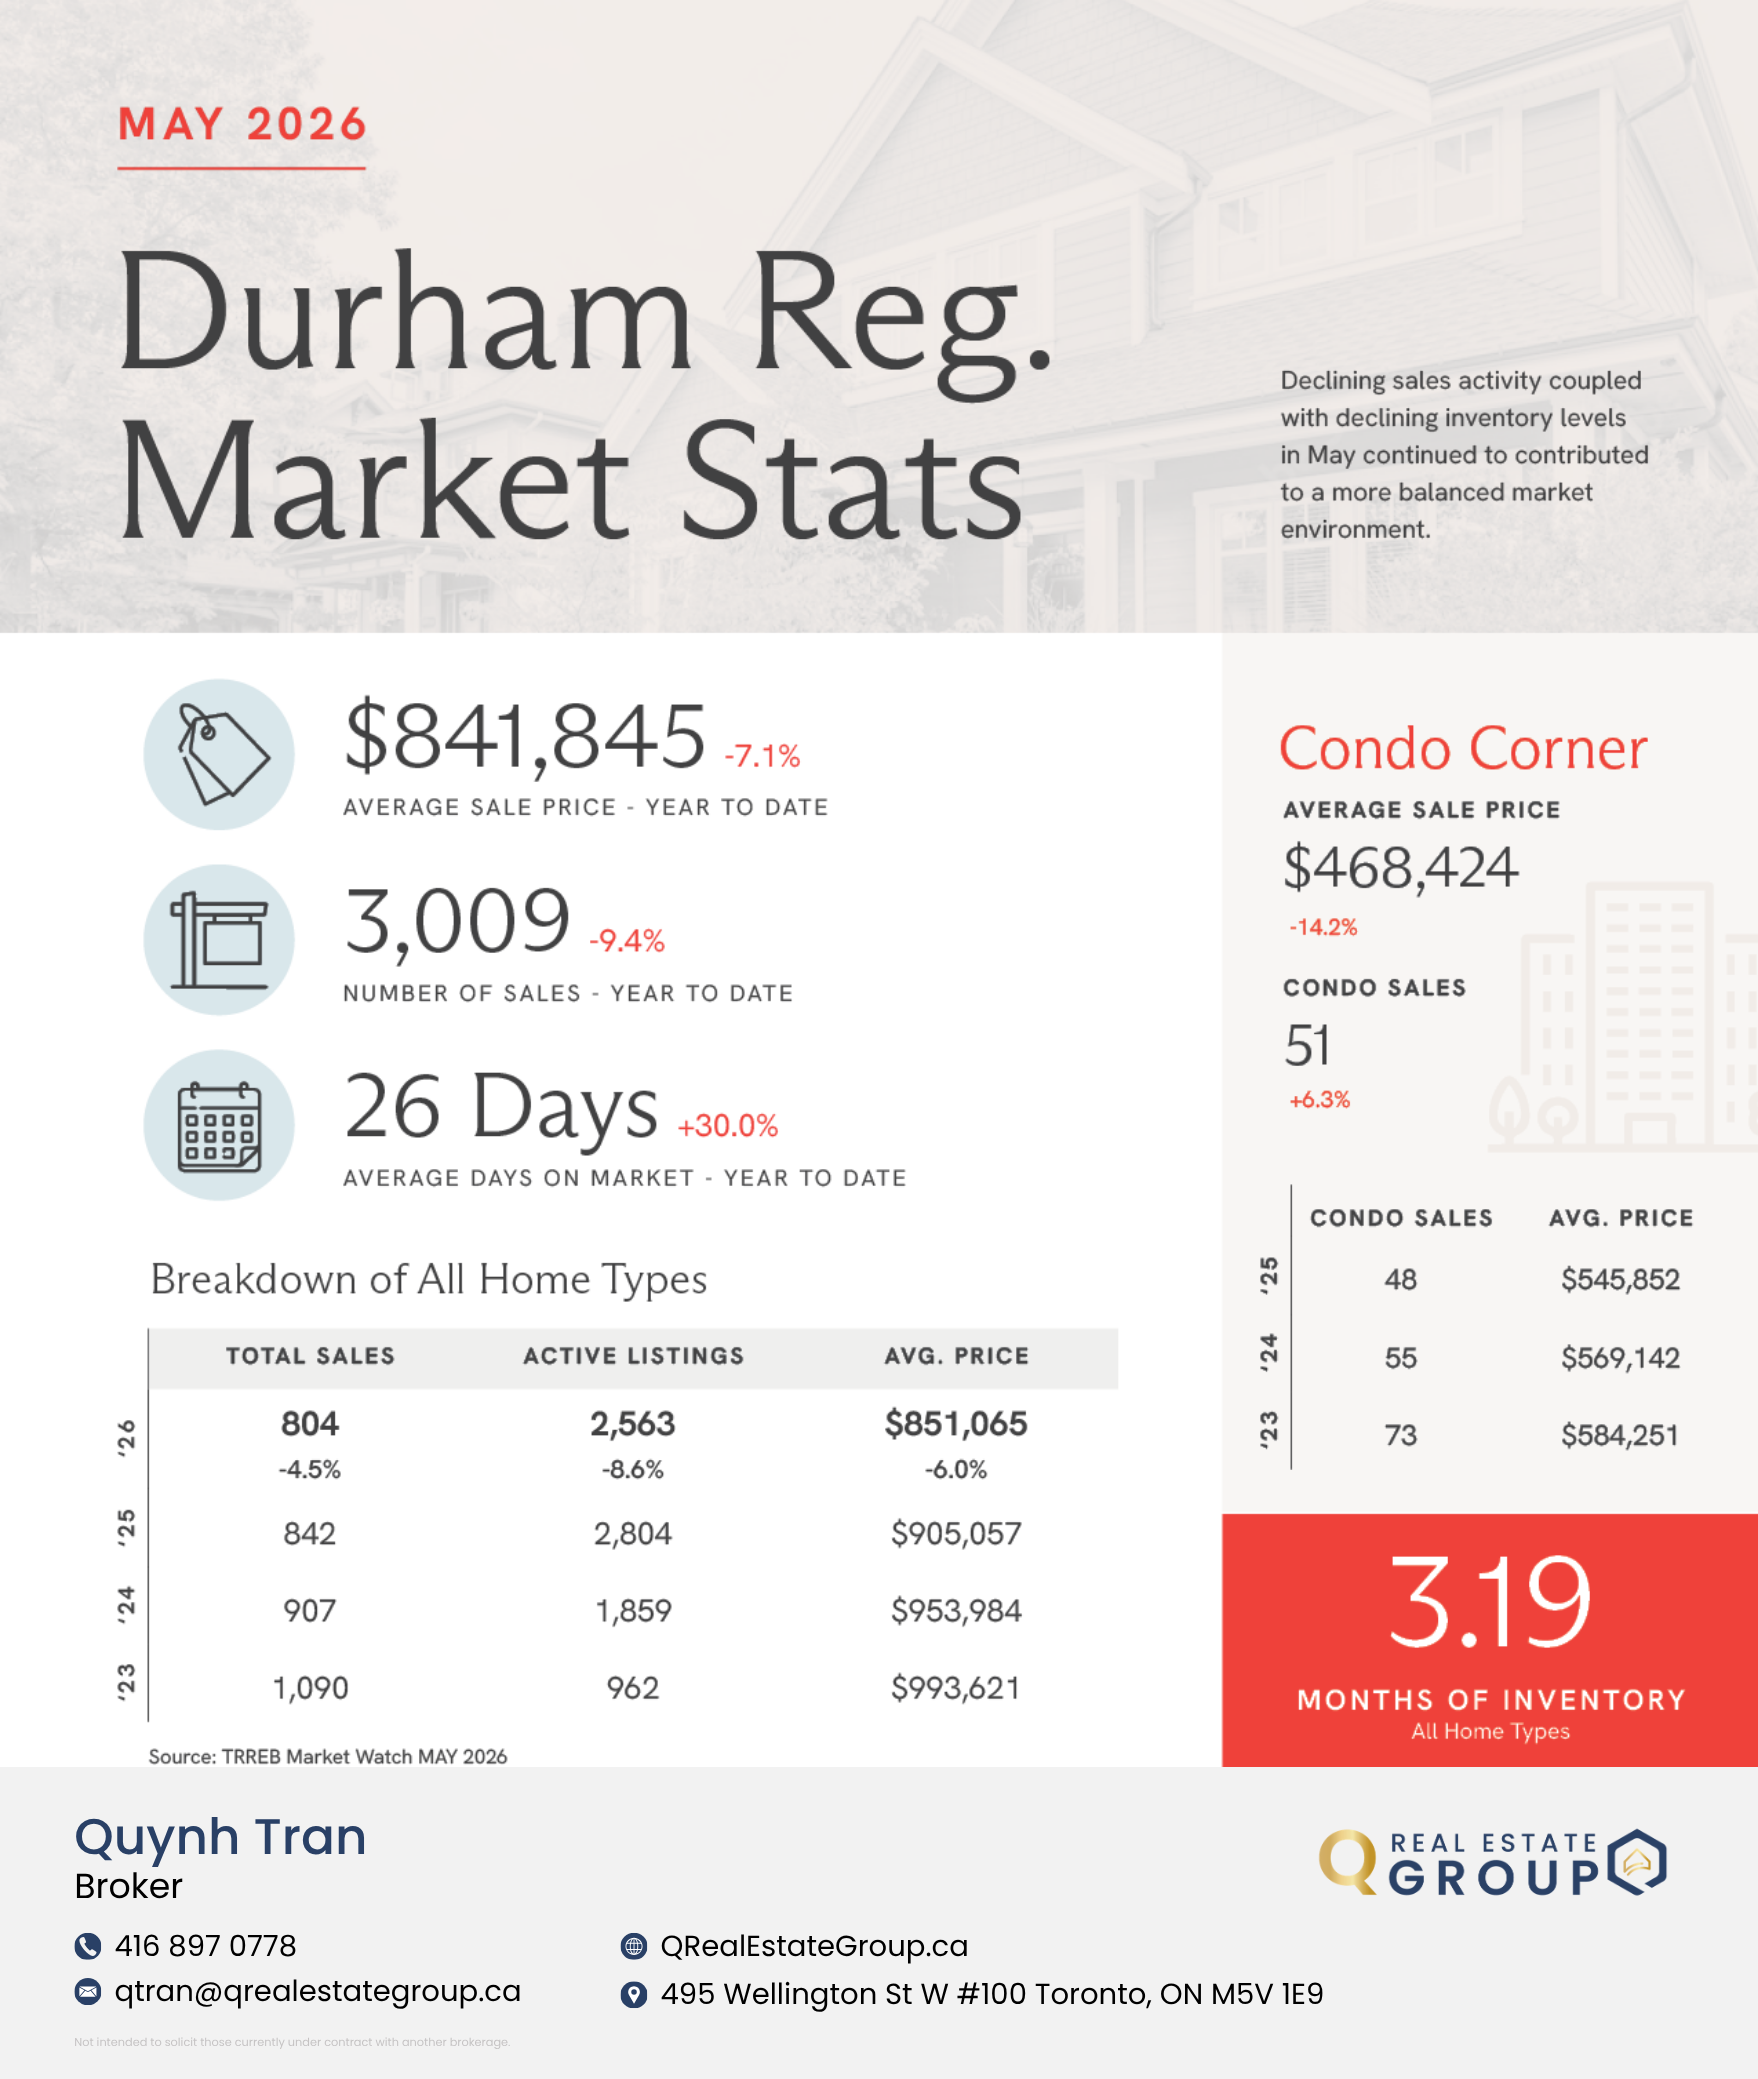
Durham Region
YTD average sale price: $841,845 (down 7.1%)
Sales down 9.4% year over year — the softest performance across tracked GTA markets
Inventory is contracting, which should provide price support going forward
What This Means If You're Selling
The market is moving — but accurate pricing is non-negotiable.
The combination of rising sales and shrinking inventory is shifting conditions back toward balance after an extended soft period. With a list-to-sale ratio of 98%, most homes are selling just under list price. This is not a bidding-war market, but overpriced properties are still sitting.
Seller takeaway: Spring 2026 is a reasonable window to list. Momentum is building, buyers are more active, and inventory is thinning. Sellers who recalibrate away from 2022 peak expectations and price accurately are seeing results.
What This Means If You're Buying
You're still in a relatively favourable position — but that window may be narrowing.
26,927 active listings across the GTA mean real choice is available. Prices remain below prior-year levels in most areas — down 5.1% YTD in Toronto, down 7.9% YTD in York Region. The GTA condo segment, at an average of $639,468 YTD (down 5.7%), remains one of the most accessible entry points in the region.
The Bank of Canada overnight rate has fallen from its 5.00% peak to approximately 2.25%, which has materially improved affordability since 2023.
Buyer takeaway: Rising sales, falling inventory, and faster days on market all suggest the window of softer pricing is closing — particularly for well-located freehold properties. If you're financially positioned, waiting for further price drops carries more risk than it did six months ago.
[A Note for First-Time Buyers
The GTA in May 2026 is not the market of 2021. Prices are below their peak in almost every area. Rates have come down substantially. Inventory is available. The condo segment, where prices have softened the most, offers the most accessible entry point the region has seen in several years.
If you've been waiting for the right time to have a serious conversation about buying, the current data supports doing exactly that.
Frequently Asked Questions
What is the average home price in the GTA in May 2026?
The GTA average sale price in May 2026 was $1,069,700. The year-to-date average is $1,032,238, down 5.6% from the same period in 2025, per TRREB Market Watch data.
Is it a good time to buy a home in Toronto in 2026?
As of May 2026, the GTA is in balanced market territory with 4.09 months of inventory and prices still below 2022 peak levels. The Bank of Canada overnight rate has fallen to approximately 2.25%, improving affordability. Inventory is contracting, which suggests the window of softer pricing is narrowing — particularly for freehold properties.
How long are homes taking to sell in the GTA right now?
In May 2026, GTA homes sold in an average of 27 days — down from 33 days in May 2025, a meaningful improvement that reflects strengthening demand across the region.
What is happening with condo prices in Toronto in 2026?
GTA condo prices averaged $639,468 YTD in 2026, down 5.7% from the prior year. In Toronto specifically, 1,009 condo sales closed in May at an average price of $673,841, making condos one of the more accessible segments for first-time buyers and investors.
Which GTA area had the strongest real estate market in May 2026?
Oakville posted a YTD average sale price of $1,477,233 — up 1.7% year over year — one of the few GTA markets in positive price territory. York Region recorded the largest sales increase, up 18.4% in May versus the prior year.
Source: TRREB Market Watch, All TRREB Areas, May 2026. This content is for informational purposes only and is not intended to solicit those already under contract with another brokerage. For market analysis specific to your property or neighbourhood, contact Q Real Estate Group at qrealestategroup.ca.