GTA Housing Market Report (June 2026): Sales Rise as Supply Tightens
Market Tightens as Listings Fall and Sales Continue to Rise in May
The GTA housing market continued its gradual recovery in May, with sales rising for the third consecutive month on an annual basis while new listings fell sharply for the fifth straight month. While these trends are encouraging, activity has been quieter than during a typical spring market. Nonetheless, active inventory is being reduced and market conditions are stabilizing. Despite these improving dynamics, average prices continued to fall for the 16th consecutive month as buyers maintained leverage in most segments. However, if demand and supply continue trending in opposite directions, some upward pressure on prices could materialize in the months ahead.
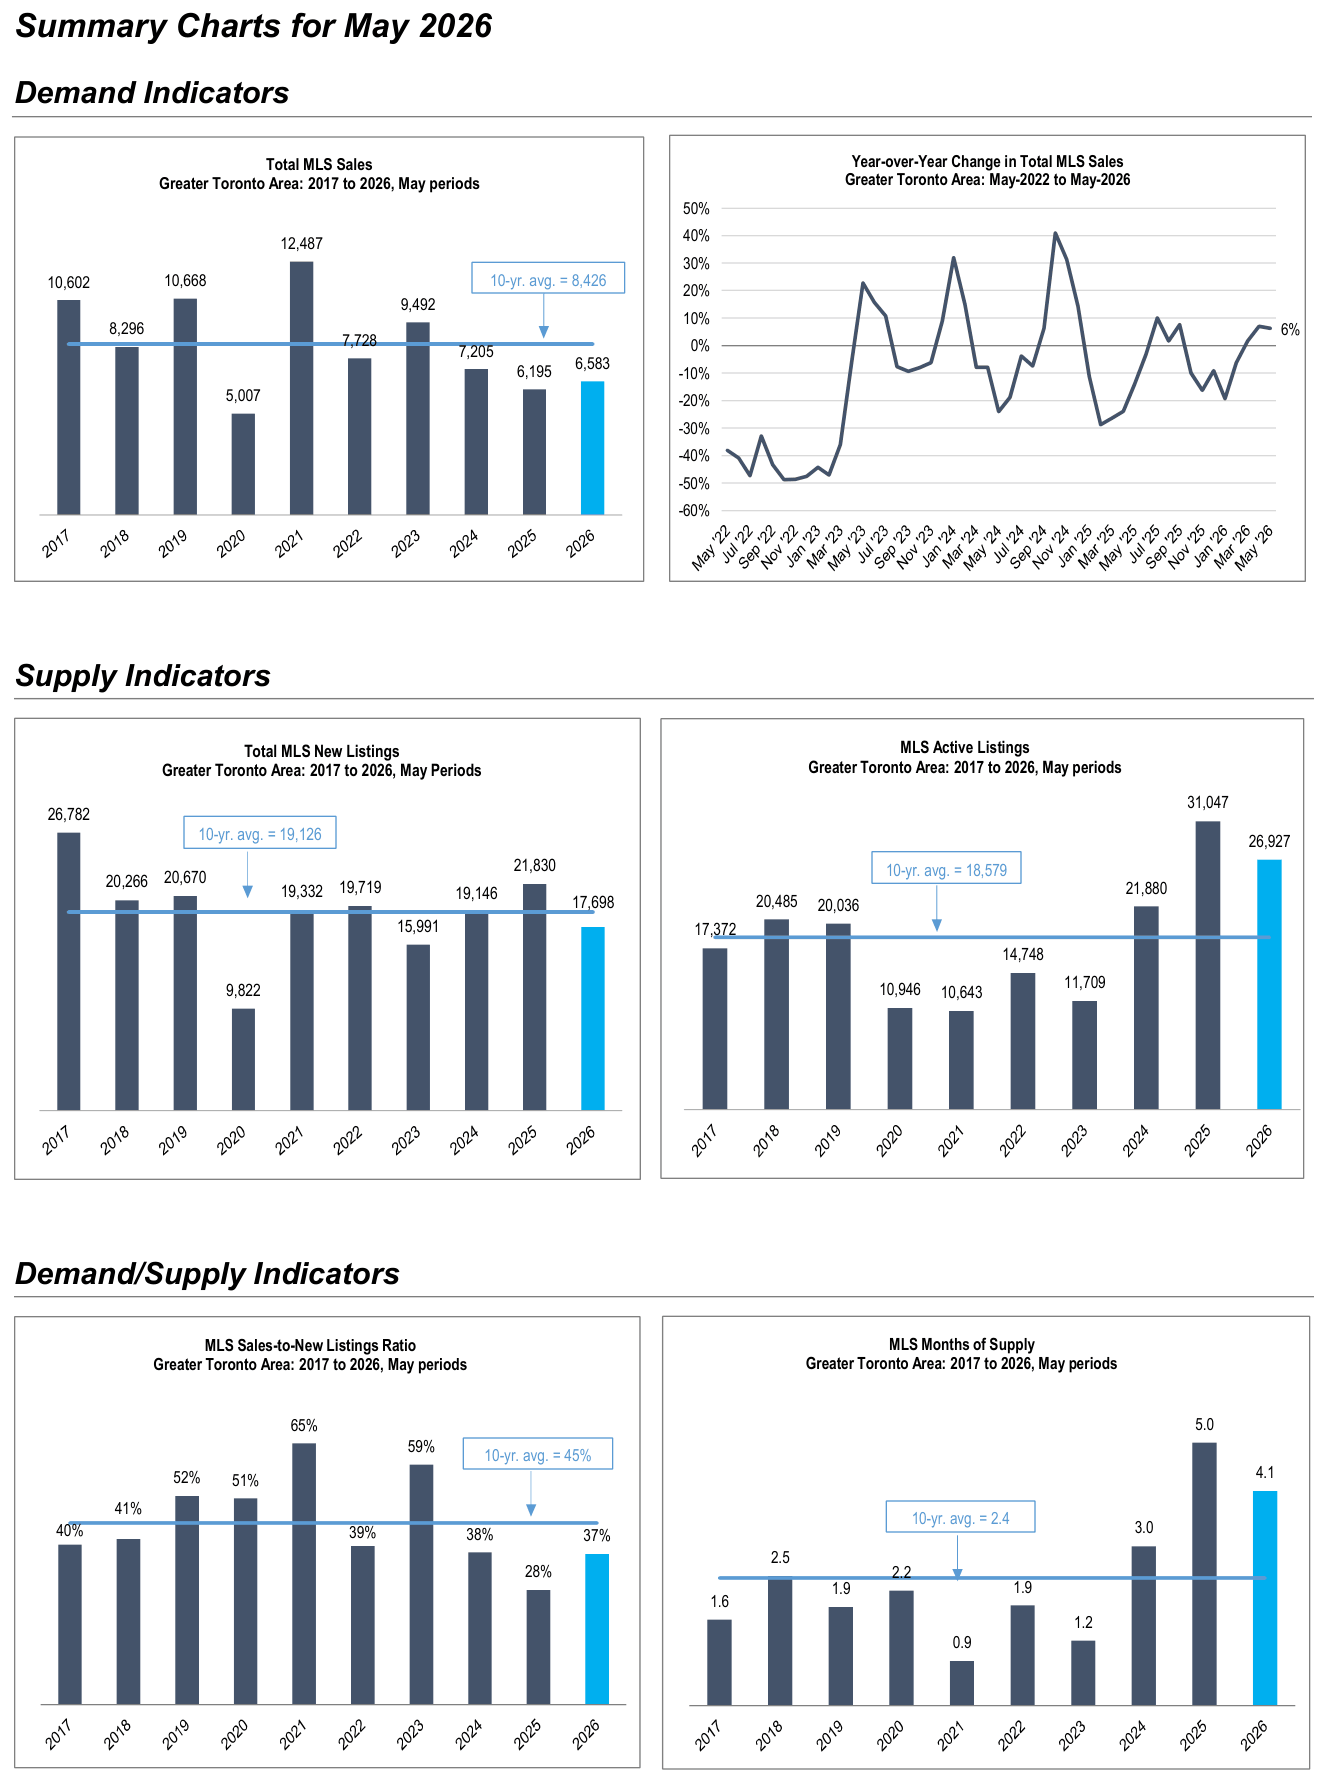
Sales Rise for Third Consecutive Month: The 6,583 MLS sales in May grew 6% from a year ago, marking the third consecutive month of year-over-year gains. As well, sales grew 10% month-over-month from April on a seasonally adjusted basis. Despite this improvement, May sales remained 22% below the 10-year average. Year-to-date sales through May are down 1% compared to the same period in 2025.
New Listings Fall Sharply for Fifth Straight Month: New listings declined 19% year-over-year in May to 17,698 homes, falling below the 10-year average for the first time in several months. This marks the fifth consecutive month of annual declines in new listings. The combination of rising sales and falling new listings brought total active listings at month-end down by 13% from last year to 26,927 homes — the steepest decline in three years. However, active listings remained 45% above the 10-year average.
Months of Supply Continues to Ease: The sales-to-new listings ratio improved to 37% from 28% a year ago, rising towards the 10-year average of 45%. Months of supply eased to 4.1 months, the lowest level since December 2024, but still above the 10-year average of 2.4 months.
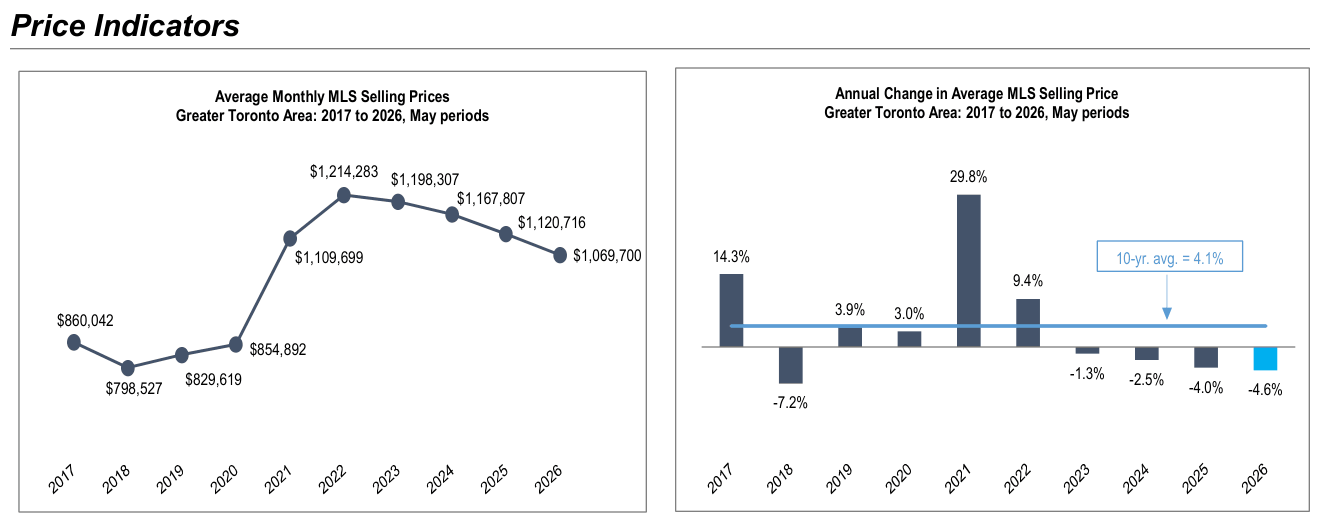
Prices Decline for 16th Straight Month: Average selling prices declined on an annual basis for the 16th consecutive month in May, with a 4.6% decrease from last year. However, this was the smallest annual decline in 12 months, and month-over-month prices edged up slightly on a seasonally adjusted basis. At $1,069,700, average prices were down approximately 20% from their peak in early 2022 but still 29% above the pre-COVID average in May 2019.
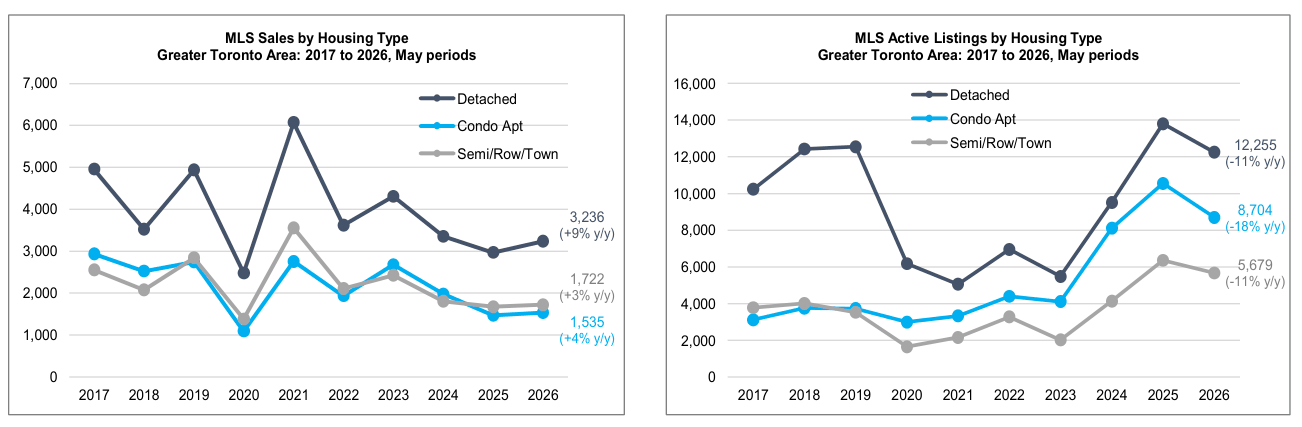
Detached Leads Sales Growth%: Detached home sales rose 9% year-over-year in May to 3,236 units. Condo apartment sales grew 4%, while semi/row/town sales were up approximately 3% on a combined basis.
Active Condo Listings Fall for Fourth Straight Month: Active condo listings fell 18% year-over-year in May to 8,704 units, still 65% above the 10-year average and the second-highest May level on record, but down on an annual basis for the fourth month in a row. Active listings for detached homes and semis/rows/towns both declined on annual basis for the third straight month, both registering an 11% decrease in May.
Detached Supply Falls Below 4 Months: Months of supply for detached homes fell to 3.8 months in May from 4.6 months a year ago. Condo apartment supply stood at 5.7 months, a sharp drop from a year ago when supply reached 7.2 months, while semi/row/town supply was 3.3 months — comfortably within a balanced range.
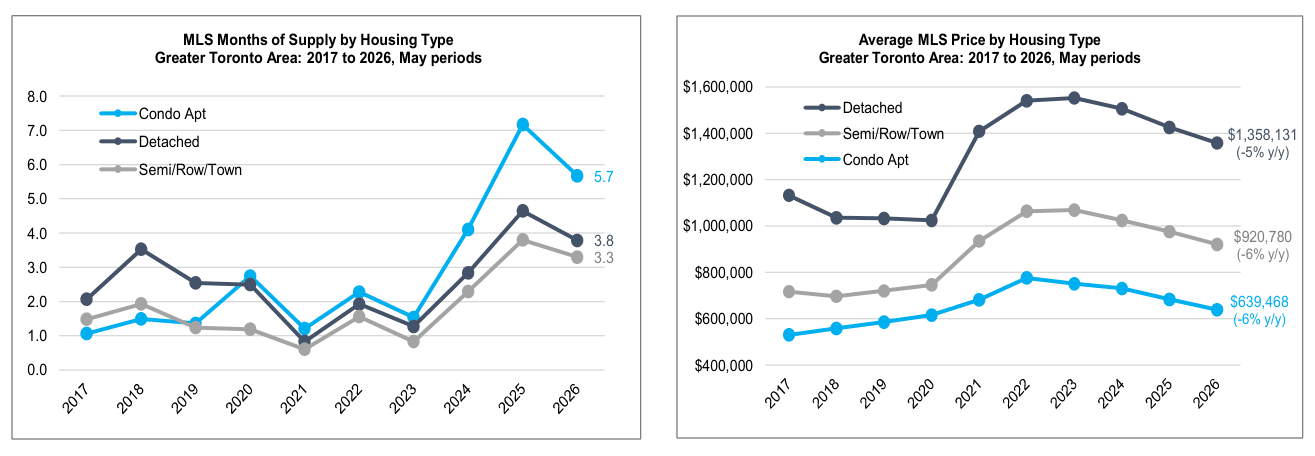
Price Declines Consistent Across Housing Types: Despite relatively softer market conditions, the 6% annual decrease in condo prices in May (to $639K) was aligned with the 6% decline for semis/rows/towns (to $921K) and the 5% decline for detached homes (to $1.36M). For each markets segment, average prices were at their lowest level since 2020. Over the past 10 years, condo prices have experienced the strongest appreciation, growing by 55%, compared to 54% for semis/rows/towns and 38% for detached homes.
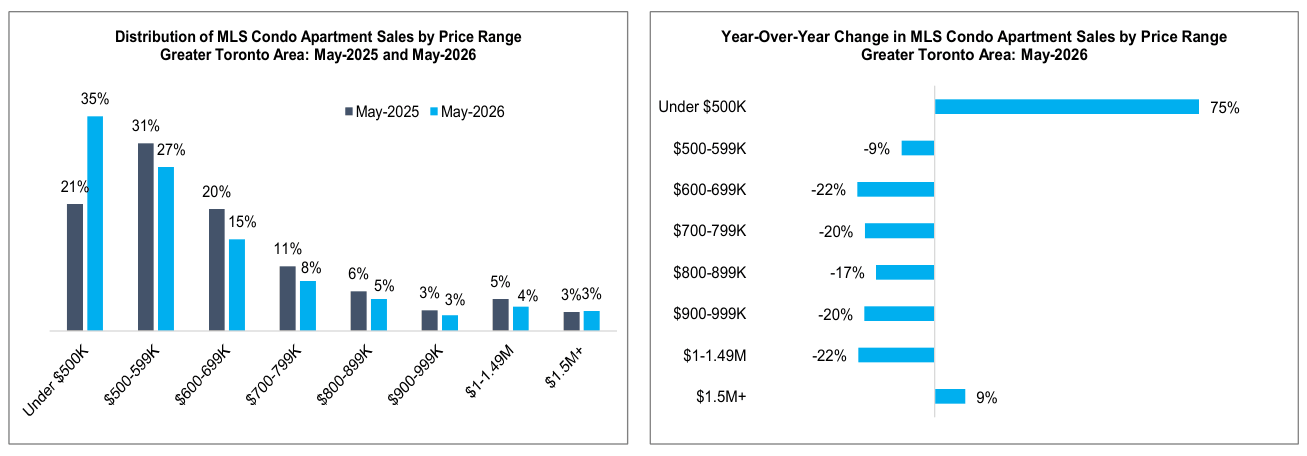
Over 60% of Condo Sales Under $600K: A 62% share of condos sold in May were priced under $600K, including a 35% share under $500K — nearly double the share from a year ago. Sales in the sub-$500K condo segment rose 75% year-over-year as improved affordability attracted buyers. The $400-499K range was the second largest price band for condos (behind $500-599K), accounting for 26% of sales. The only other price segment for condos to see growth in sales was the $1.5M+ category, which rose 9% annually.
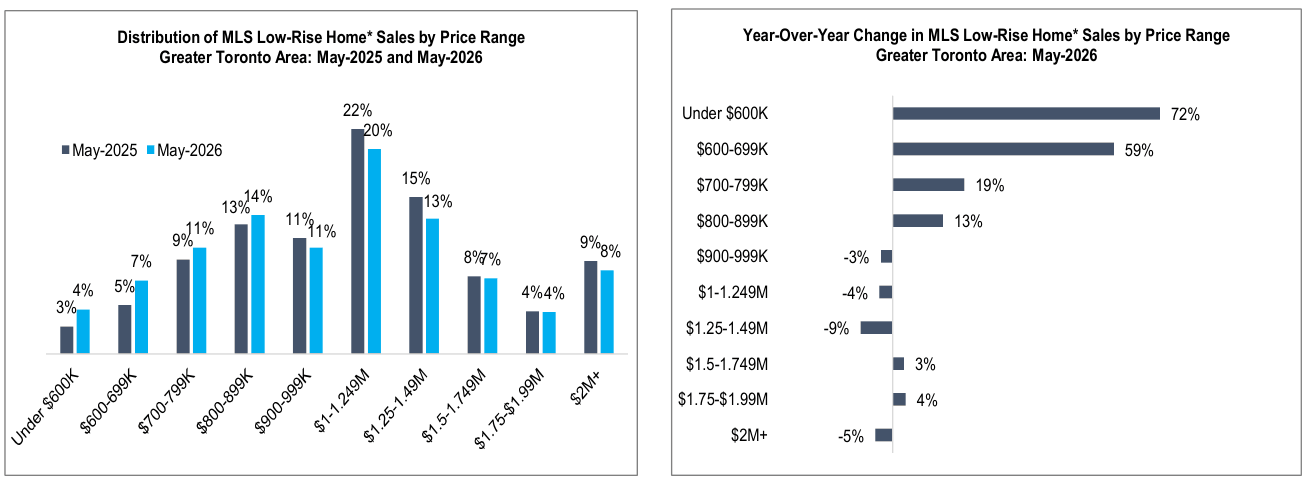
Low-Rise Activity Strongest Below $900K: For low-rise homes, all price segments under $900K saw year-over-year sales gains in May, led by a 72% increase in transactions under $600K, largely comprised of semis/rows/towns. Meanwhile, low-rise sales declined across most price brackets above $900K, with the exception of homes priced between $1.5-1.99M, which grew 3% annually and represented a 12% share of sales.
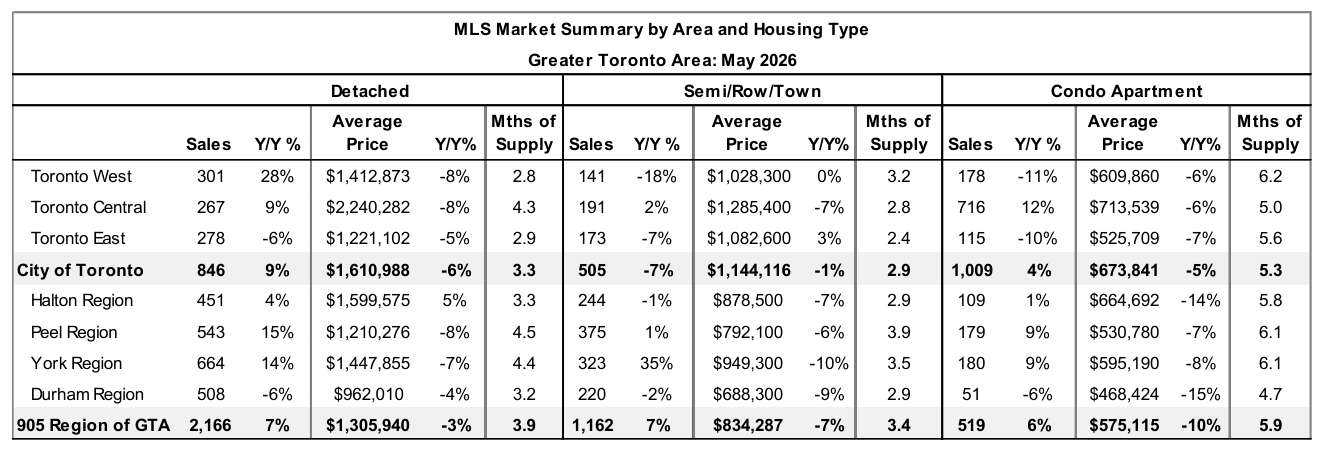
Toronto West Leads Detached Sales in May: Detached sales rose 28% annually in Toronto West, with double-digit gains also found in York Region (+14%) and Peel Region (+15%) in May. In Toronto West, months of supply for detached homes fell to only 2.8.
Prices for Semis/Rows/Towns Up 3% in Toronto East: Average prices rose 3% annually for semis/rows/towns in Toronto East, reaching $1.08M as months of supply fell to only 2.4.
Central Toronto Condo Supply Falls to 5.0 Months: Sales for condos in Central Toronto rose 12% year-over-year in May to 716 units, with average prices of $714K (down 6% annually). Supply in Central Toronto stood at 5.0 months — below the GTA condo average of 5.7 months.
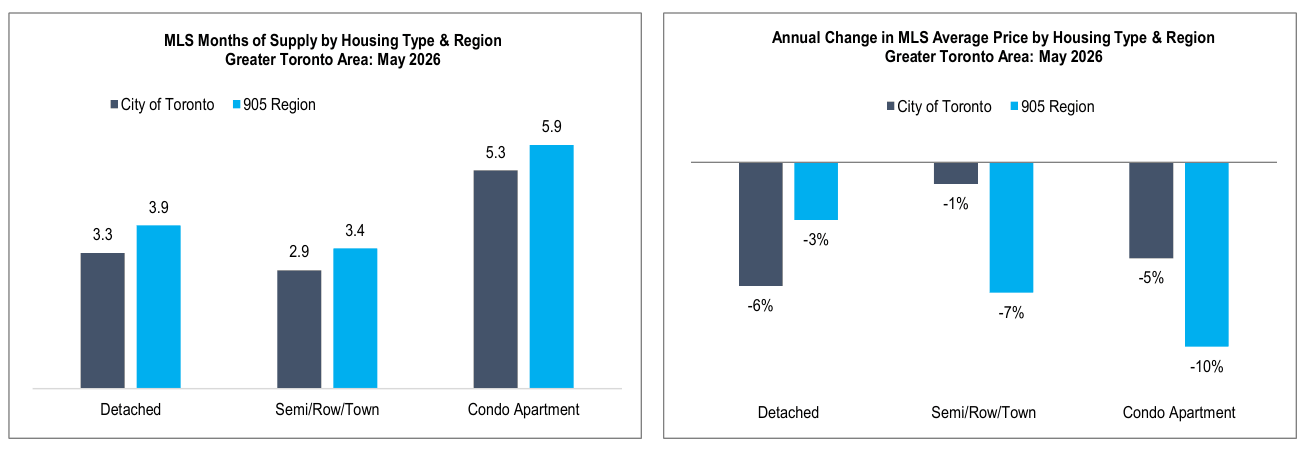
905 Region Condo Prices Drop 10%: Average selling prices for condos in the 905 Region were down 10% annually in May to $575K, falling by twice the speed as prices in the City of Toronto (-5% to $674K).
Key Takeaways
The GTA market recorded its third consecutive month of year-over-year sales gains in May, with new listings falling sharply for the fifth straight month. This tightening of supply is gradually rebalancing the market. While the direction of demand and supply is encouraging, the market remains in the early stages of its recovery and spring activity has been quieter than typically expected for this time of year. Prices are beginning to stabilize but will require several more months of sustained demand outpacing supply to see meaningful upward pressure.
The Bank of Canada held its overnight rate at 2.25% for a fifth consecutive meeting on June 10, citing the need to balance the competing risks of weak economic activity and elevated energy-driven inflation. While headline inflation has risen to approximately 2.8% largely due to energy prices tied to the Middle East conflict, core inflation has moved down to around 2.1%, limiting broader inflationary pass-through and the need for higher interest rates. The Bank indicated it stands ready to adjust rates in either direction depending on how trade and geopolitical risks evolve, with potential rate cuts if growth weakens further or consecutive hikes if energy-driven inflation becomes persistent. Financial markets and major bank forecasters broadly expect the policy rate to remain on hold through the remainder of 2026, with the next scheduled announcement on July 15.
The Canadian economy entered a technical recession after real GDP contracted on an annualized basis for two consecutive quarters — declining 1.0% in Q4 2025 and a further 0.1% in Q1 2026 — reflecting weakness tied to U.S. trade uncertainty. However, the latest May 2026 employment report provided a significant positive surprise, with full-time employment jumping by 154,000 jobs and the unemployment rate declining, suggesting the economy is averting an actual recession. This resilience in the labour market is an important foundation for housing activity, as sustained employment supports buyer confidence and purchasing capacity. April GDP is also tracking a 0.4% monthly rebound, pointing to a potential second quarter recovery.
Five-year fixed mortgage rates have stabilized just above 4%, and the combination of lower prices (down ~20% from peak) and stable rates has meaningfully improved affordability relative to 2022, helping to draw out buyers at entry-level price points. With affordability likely at its bottom and the economy showing good resiliency, the housing market should continue to improve in the months ahead.
The condo market is now showing clear signs of cyclical recovery. New condo listings have fallen for nine consecutive months, including a 24% annual drop in May, which is bringing inventory down from its peak. Entry-level condos priced under $600K are seeing a surge of activity, with a notable improvement in activity within Toronto Central. As completions from the 2024–2025 record high continue to fall, further improvement in condo supply metrics is expected through the remainder of 2026, helping to support price stability.