GTA Housing Market Analysis (June 2026): Key Trends for Halton & Toronto Buyers
Sales Reach Three-Year High as Supply Tightens Further in June
The GTA housing market continued to build momentum in June, with sales rising annually for the fourth consecutive month to reach their highest level in three years. New listings fell for the sixth straight month and are now below the 10-year average a meaningful shift from the elevated supply environment of the past two years. Active listings are descending from their peak, market conditions are balancing and the pace of decline for prices is moderating, indicating a gradual stabilization for the GTA market.
Sales Reach Three-Year High on Fourth Straight Month of Gains: The 6,770 MLS sales in June grew 9% from a year ago, marking the fourth consecutive month of year-over-year gains and the highest monthly total since June 2023. Despite this improvement, June sales remained 17% below the 10-year average. With this latest increase, year-to-date sales through June are now up 1.4% compared to the same period in 2025.
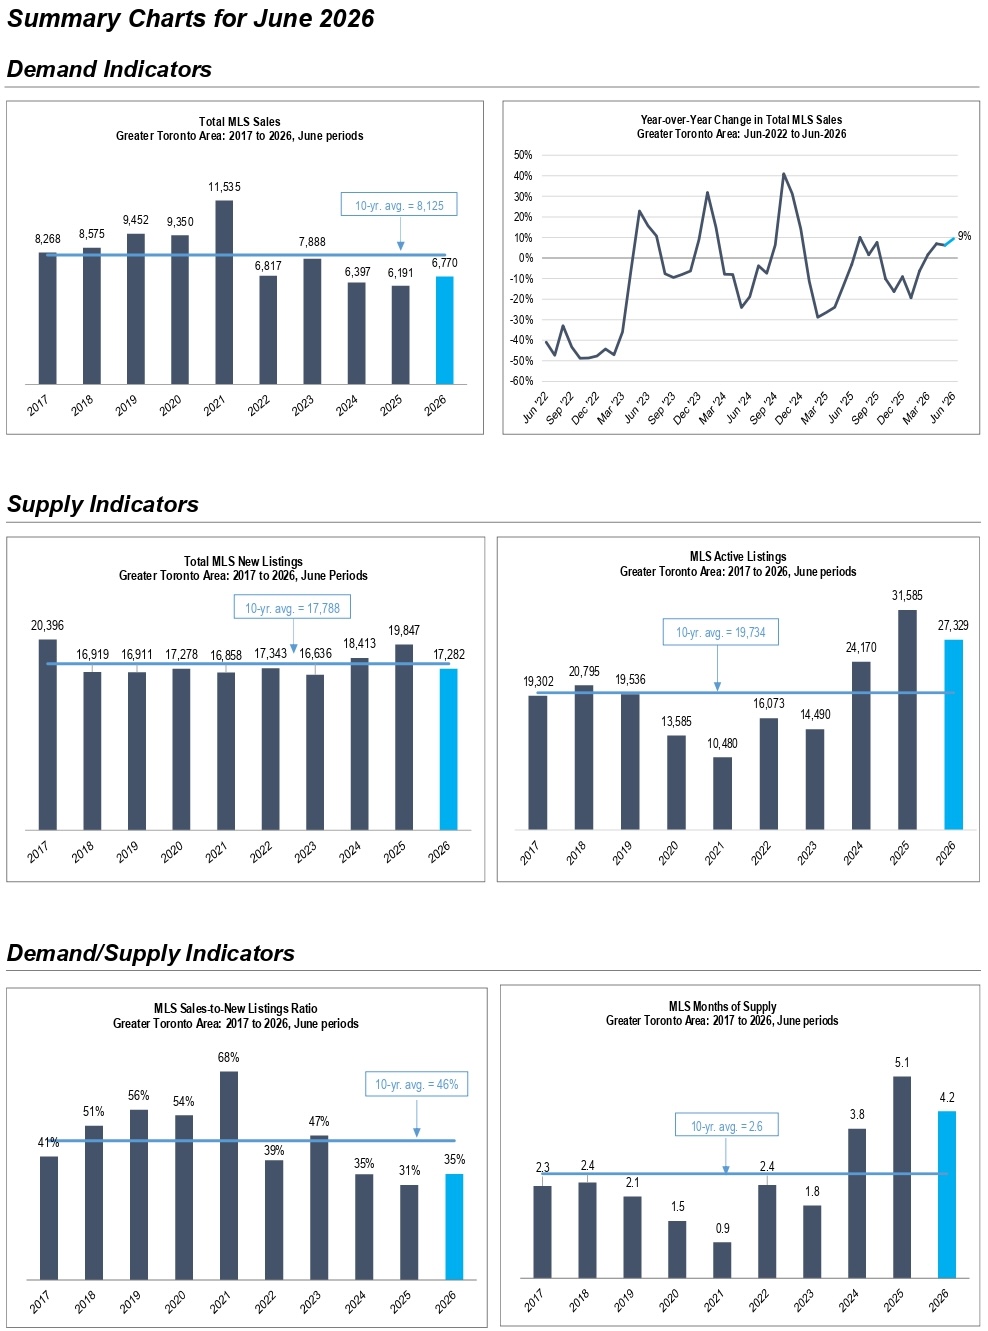
New Listings Fall for Sixth Straight Month: New listings declined 13% year-over-year in June to 17,282 homes, remaining below the 10-year average for the second consecutive month. This marked the sixth consecutive month of annual declines in new listings. The combination of rising sales and falling new listings brought total active listings at month-end down by 13% from last year to 27,329 homes - the second consecutive month of double-digit annual declines. Active listings remained 38% above the 10-year average.
Months of Supply Returns Toward Balanced Levels: The sales-to-new listings ratio of 35% in June was still in buyer's market territory, but trending toward the 10-year average of 46%. If current trends of rising sales and falling listings remain in place, balanced conditions will emerge in the coming months. Months of supply fell to 4.2 approaching the 4-month threshold that signals a balanced market and well below the 5.1 months recorded a year ago.
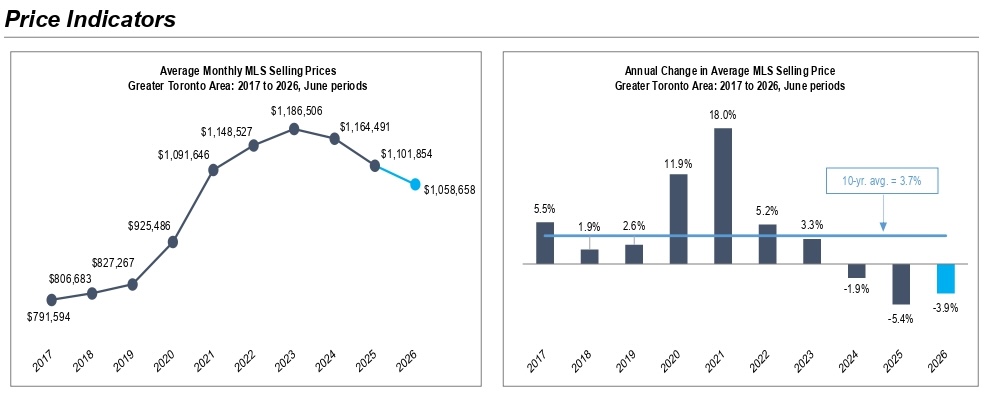
Smallest Price Decline in 15 Months as Stabilization Continues: Average selling prices declined on an annual basis for the 17th consecutive month in June, with a 3.9% decrease from last year - the smallest annual decline in 15 months. Seasonally adjusted prices edged up slightly for the second month in a row, pointing to gradual price stabilization. At $1,058,658, average prices have been effectively unchanged (-3%) over the past five years. Notably, the 10-year average annual growth rate for prices has slowed to 3.7%, which is below the long-run historical average of 6%, suggesting the market may be reaching a cyclical price bottom.
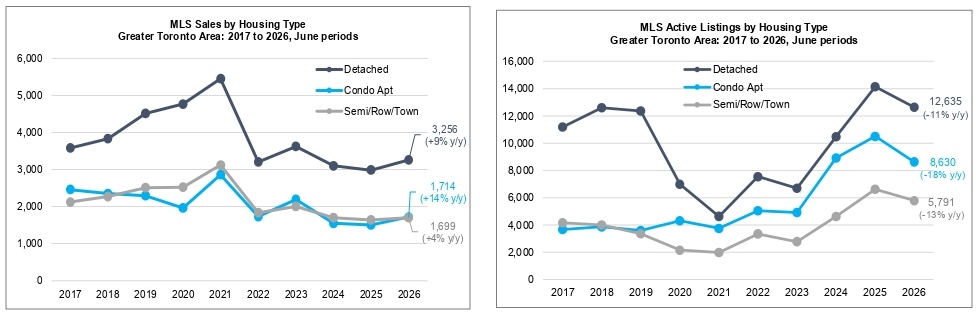
Condos Lead Sales Growth as First-Time Buyers Return: Condo apartment sales led all housing types with a 14% annual increase in June to 1,714 units, supported by recent Teranet data showing a rebound in first-time buyer activity. Detached home sales rose 9% annually to 3,256 units, while semi/row/town sales grew 4% on a combined basis to 1,699 units. Detached homes were the only category to see sales rise on a year-to-date basis (+4%), while condo apartment sales were flat and sales of semis/rows/towns decreased 3% so far this year.
Active Condo Listings Drop 18% as Supply Tightens Sharply: Active condo listings fell 18% year-over-year in June to a three-year low of 8,630 units the largest annual decline of any segment. While active condo listings were still 51% above their 10-year average, they are clearly trending down with new listings falling for the 10th straight month on an annual basis, now 3% below their 10-year average. Active listings for detached homes declined 11% year-over-year and were 27% above their 10-year average, while active listings for semis/rows/towns fell 13% and were 49% above their 10-year average.
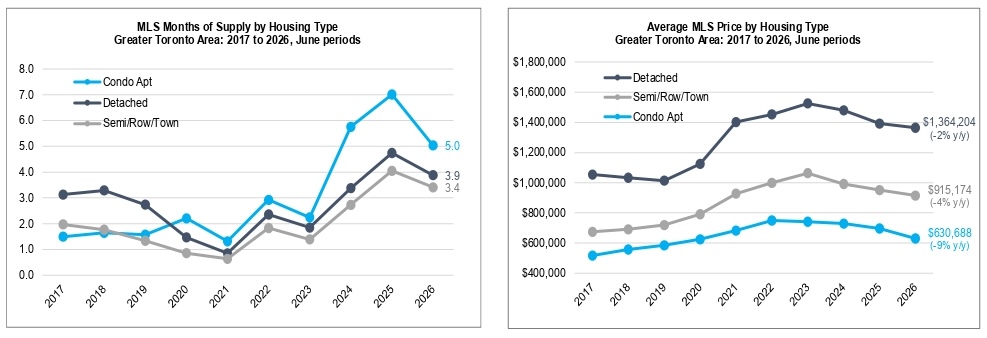
Detached Supply Reaches Balanced Levels Across Much of GTA: Months of supply for detached homes fell below the 4-month threshold (3.9 months) in June, down from 4.7 months a year ago. Condo apartment supply fell to a 19-month low of 5.0 months, a significant improvement from 7.0 months a year ago. Semi/row/town supply was the most balanced at 3.4 months, with an above-average ratio of sales-to-new listings at 42%.
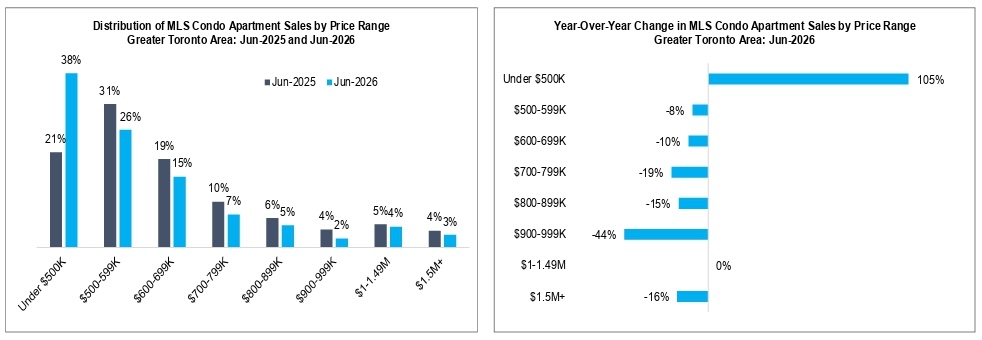
Price Declines Narrow Significantly for Detached Homes: Average prices are beginning to stabilize within the detached segment, which recorded a 2% annual decrease in June — the smallest detached price decline in 16 months. The semi/row/town category saw prices decrease 4% from last year, the smallest annual decline in 14 months. Meanwhile, condo prices fell 9% annually in June, signalling sellers are becoming more flexible on prices to negotiate deals. Despite the outsized decrease in prices for condos, they have been one of the best performing property types for prices appreciation over the past 10 years, rising approximately 49%, compared to 50% for semis/rows/towns and 39% for detached homes.
Surge in Entry-Level Condo Activity: A 38% share of condos sold in June were priced under $500K — up from a 21% share recorded a year ago as sales volume more than doubled, driven by a surge of first-time buyers at entry-level price points. The $400-499K price band was the largest single category, accounting for 26% of condo sales. Combined, condos priced under $600K represented 64% of all condo sales. Sales of condos priced above $700K declined in most price brackets, reflecting the ongoing affordability-driven shift in buyer behaviour.
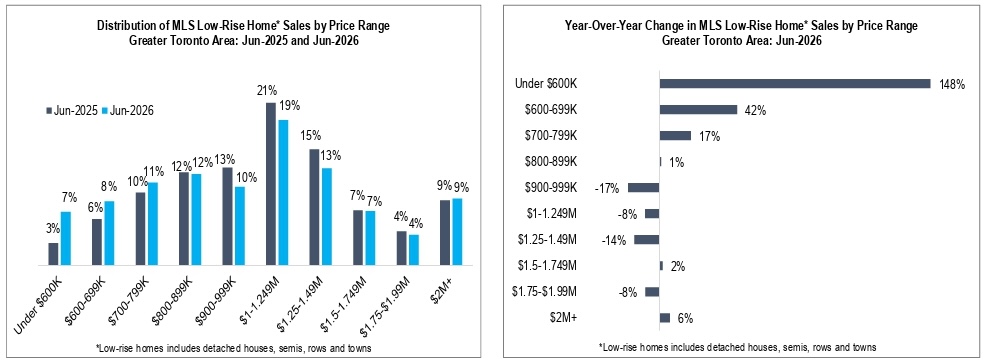
Low-Rise Entry-Level Activity Spikes: For low-rise homes, all price segments under $900K saw year-over-year sales gains in June, with the strongest growth seen in the entry-level segment below $600K with a 148% increase. However, homes priced in this category represented only 7% of low-rise activity. Homes priced under $900K collectively accounted for 38% of low-rise sales, up from 31% a year ago. Low-rise sales declined across most price brackets above $1M, with the exception of homes priced $1.5-1.749M (+2%) and homes priced at $2M-plus (+6%).
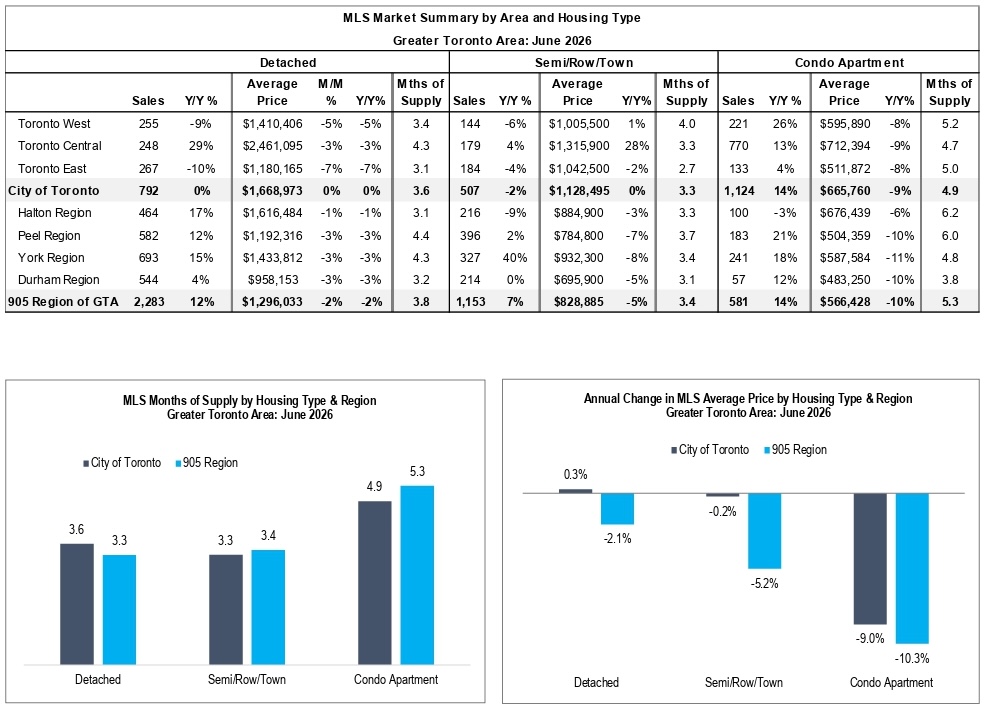
Central Toronto Detached Leads Sales Growth: Toronto Central detached homes led sales growth across all regions and property types in June with a 29% annual gain. Overall, detached prices in Toronto held steady year-over-year, with months of supply falling to 3.4. Double-digit sales growth for detached homes was also seen in Halton (+17%), Peel (+12%) and York (+15%).
Toronto East Semis/Rows/Towns are Tightest Market Segment in GTA: Toronto East semis recorded only 2.7 months of supply in June the tightest of any segment in the GTA with an average price of just above $1M. Overall, prices for semis/rows/towns in Toronto were stable over the past year, while declining 5% annually in the 905 Region.
Condo Market Tightening in Central Toronto: Supply in Central Toronto fell to 4.7 months - representing one of the lowest amounts of condo inventory across the GTA. Condo sales grew strongest in Toronto West with a 26% annual gain. Peel and York Regions also saw strong increases in condo sales of 21% and 18%, respectively. Months of supply fell below 5 months in York Region (4.8) but remained elevated in Peel Region at 6.0 months.
Key Takeaways
Last month produced the strongest June sales total in three years and marked the fourth consecutive month of year-over-year gains - a significant milestone for market recovery. New listings fell for the sixth straight month and dropped below the 10-year average, a combination that is steadily drawing down the inventory overhang built up since 2022. With sellers appearing to hold back supply, perhaps in anticipation of better prices, and buyers increasingly motivated by improved affordability and entry-level opportunities, the market is tightening at a faster pace than many anticipated.
Multiple signals now point to a cyclical price bottom: the 10-year average annual price growth rate has slowed to 3.7% well below the historic norm of 6% seasonally adjusted prices have edged up two months in a row, and detached prices in Toronto are essentially flat year-over-year. Sustained demand gains over the coming months could result in upward price pressure, particularly in the low-rise segment where supply is already at balanced levels.
The June jobs report provided a significant positive surprise, with 88,000 net new jobs added and the unemployment rate dipping to 6.6%. As well, GDP rebounded 0.5% in April the strongest monthly gain since mid-2025 - reinforcing the notion that the economy has avoided a recession after contracting in Q4 2025 and Q1 2026. Most major bank economists and financial markets now expect the overnight rate to remain at 2.25% through the remainder of 2026, with the risk slightly skewed toward a late-2026 or early-2027 hike if energy-driven inflation becomes broad-based. However, the CUSMA trade review formally beginning in July 2026 adds a further source of uncertainty that could keep the Bank of Canada on the sidelines if negotiations prove prolonged or unfavourable.
Five-year Government of Canada bond yields and fixed mortgage rates have stabilized around 3% and 4%, respectively. However, the ceasefire between the US and Iran signed June 17 broke down in early July, sending oil prices sharply higher again. Canada's May headline inflation rose to 3.2% on surging gasoline costs, though core measures held steady at approximately 2%, well within target. A re-escalation of the conflict is the primary near-term risk to bond yields and fixed mortgage rates.
Buyers are sensing a bottom for both mortgage rates and prices, driving a particularly strong surge in first-time buyers entering the market. Meanwhile, the widely anticipated wave of mortgage renewals has not translated into forced selling a meaningful development that helps explain why new listings keep falling. Existing owners are absorbing higher renewal rates, choosing to hold rather than sell, which is structurally supportive of prices.
The condo market recovery is accelerating: new listings have fallen for 10 consecutive months, months of supply has dropped to 5.0 from 7.0 a year ago, and Central Toronto supply is below 5 months for the first time since early 2023. Condo starts have already fallen to their lowest level since 1996, meaning the pipeline of new completions will thin considerably as the 2024-2025 wave winds down. With demand rising and supply structurally tightening, the conditions for condo price stabilization and eventually recovery are increasingly in place.