GTA Housing Market Update October 2026 | Q Real Estate Group
GTA Housing Market Update: October 2026
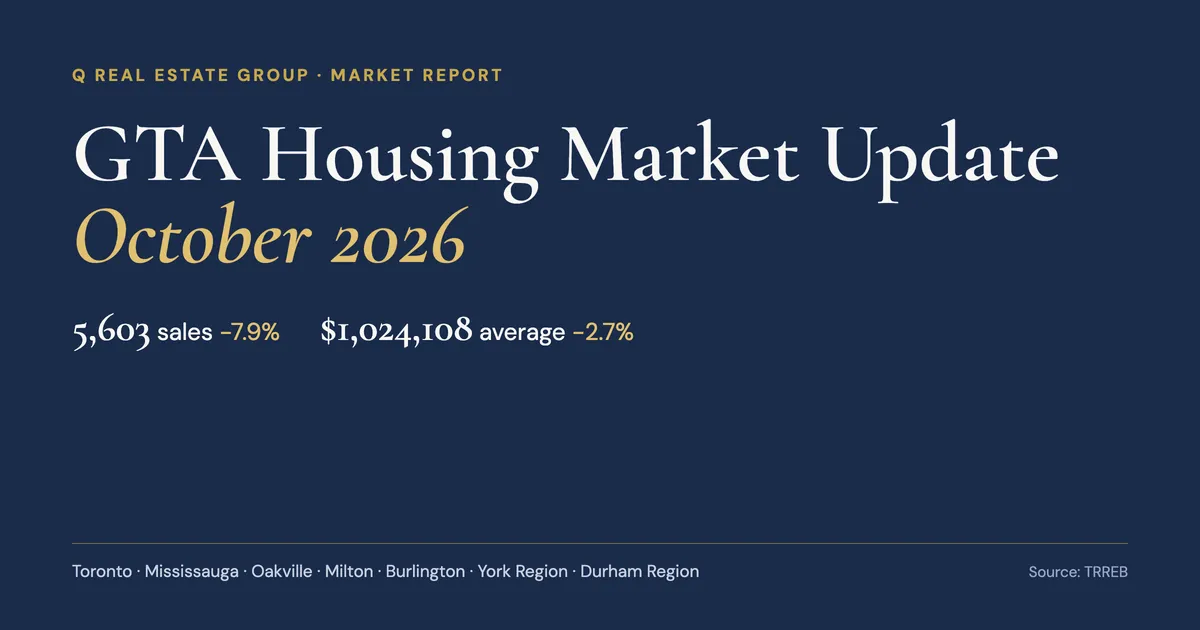
Greater Toronto Area home sales came in at 5,603 in October 2026, down 7.9% from October 2025, according to the Toronto Regional Real Estate Board (TRREB). The average selling price was $1,024,108, down 2.7% year over year. Buyers still hold meaningful negotiating room, but the gap between this October and last is narrowing in several parts of the region.
The GTA at a glance
New listings fell faster than sales. Sellers brought 14,173 new listings to market, down 11.9% from a year ago, and active listings at month end were down 10.0% to 25,098. When supply shrinks faster than demand, conditions tend to firm up over time rather than overnight.
The month-over-month picture was more encouraging. Sales rose from 5,034 in September to 5,603 in October, and TRREB reports that both sales and the average price edged up on a seasonally adjusted basis. The MLS Home Price Index composite benchmark sits at $916,400, down 4.3% year over year.
Homes sold for 97% of list price on average after 31 days on market. That tells you most sellers are negotiating, and most buyers are not bidding over asking.
Why buyers are cautious
TRREB attributes the slower pace to uncertainty about inflation, borrowing costs and the broader economy. September inflation was 3.1% and TRREB's report lists the five-year mortgage rate at 6.19%. TRREB's chief information officer noted that lower selling prices have offset much of the impact of higher borrowing costs on monthly payments, and that payments remain well below what buyers faced in 2023 and 2024.
City of Toronto
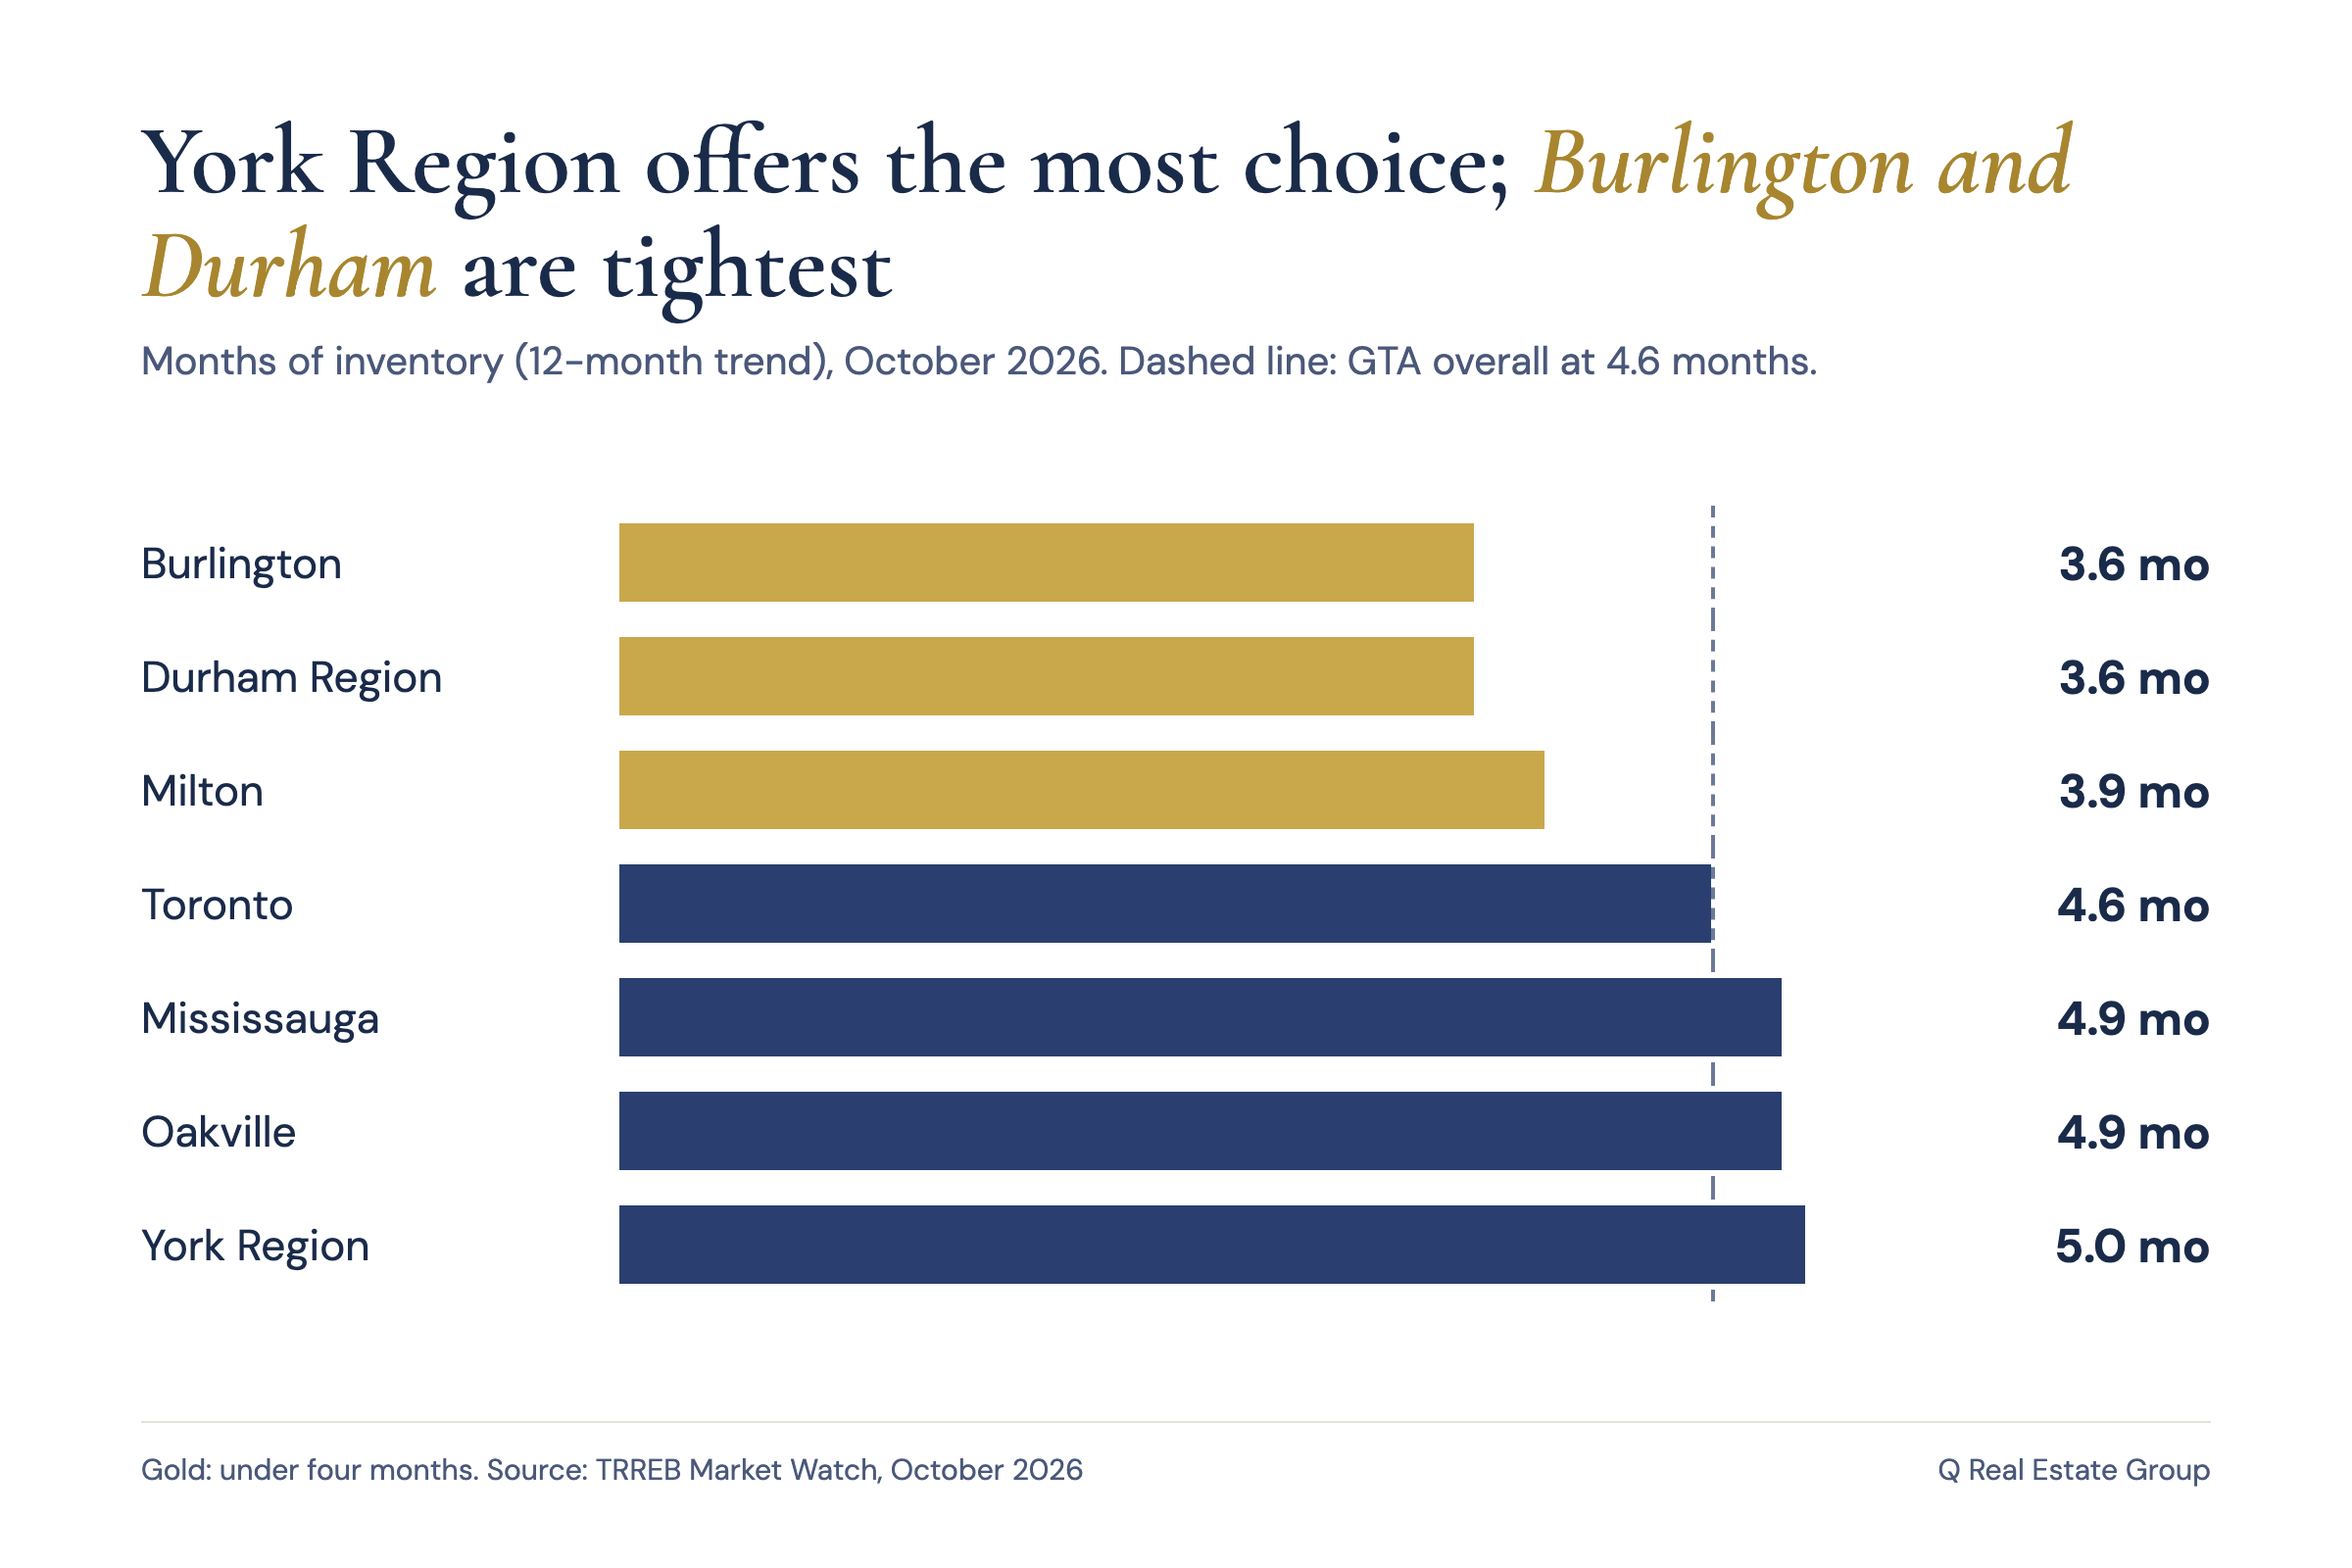
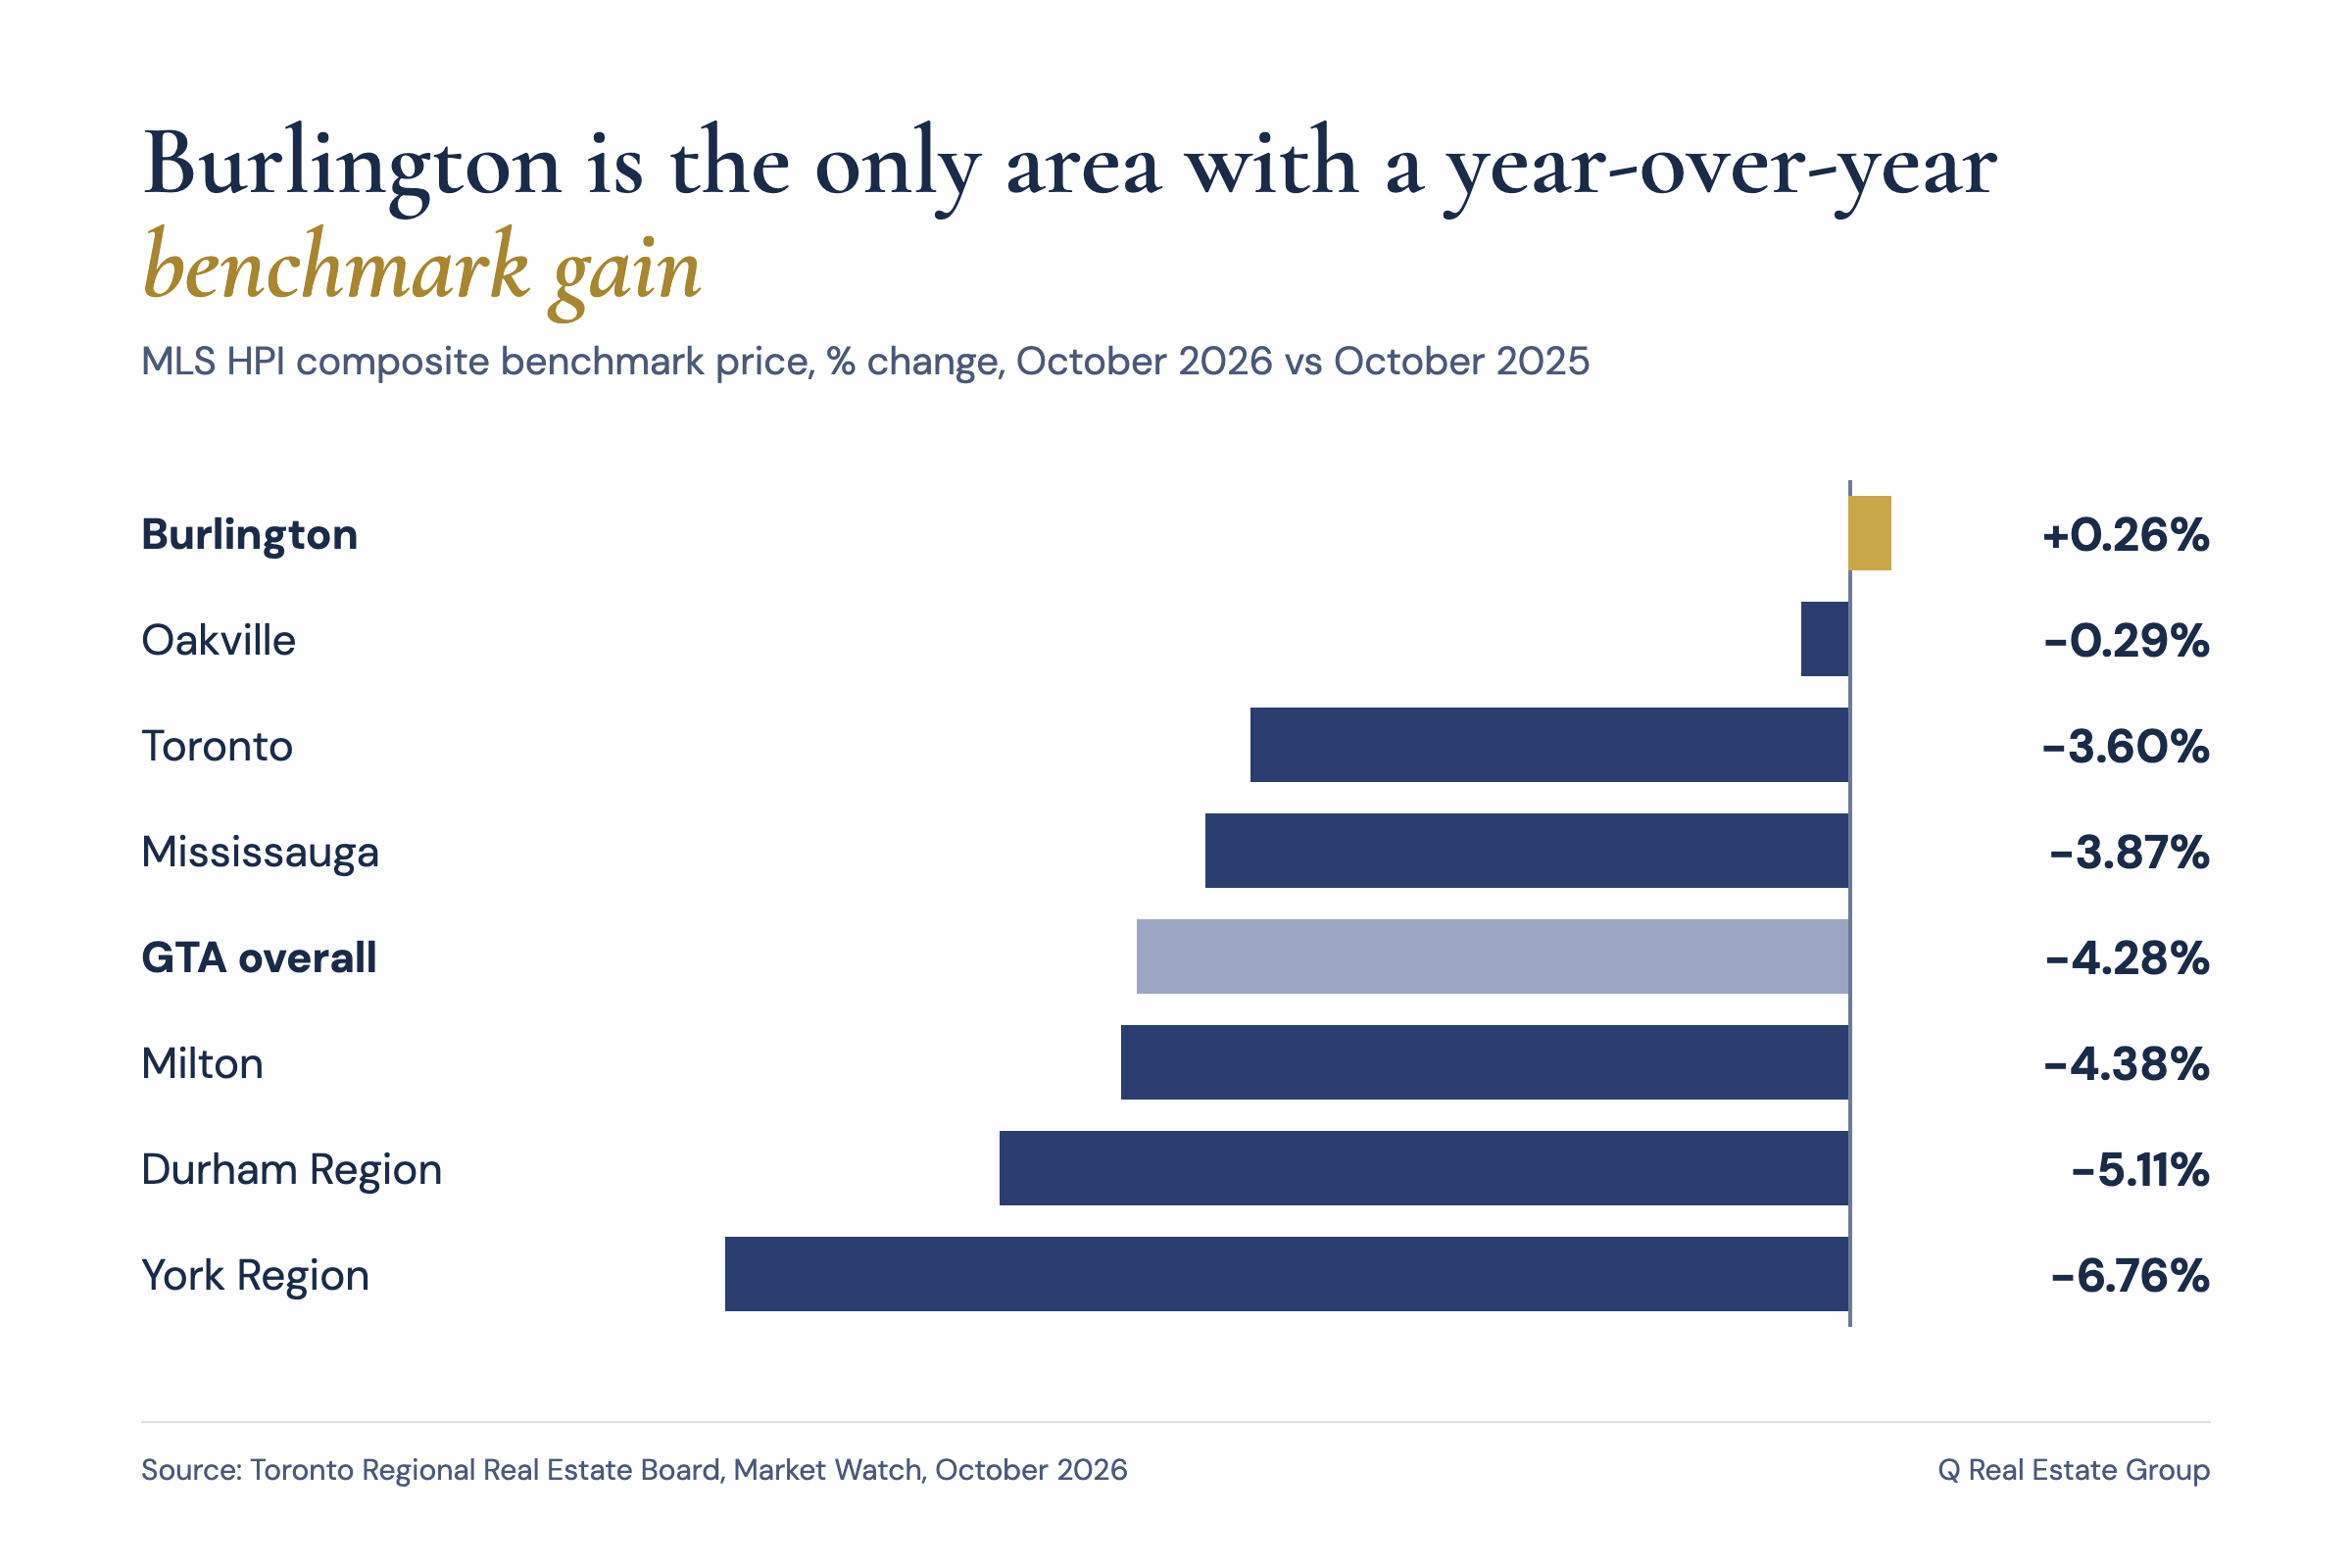
Toronto recorded 2,184 sales at an average price of $1,075,627 and a median of $835,000. The benchmark price is down 3.6% year over year to $908,800. Inventory sits at 4.6 months, in line with the GTA overall.
The city is not one market. Toronto East remains the most competitive district, with homes selling for 101% of list on average and 3.7 months of inventory. Toronto Central has 5.1 months of inventory and an average sale-to-list ratio of 96%, giving buyers more room there.
Mississauga
Mississauga posted 508 sales at an average of $927,521 (median $843,000). The benchmark price is down 3.9% year over year to $860,100. With 4.9 months of inventory and homes averaging 35 days on market, buyers have time to compare options and negotiate.
Oakville
Oakville had 191 sales at an average of $1,383,011 (median $1,220,000). Its benchmark price of $1,148,800 is essentially flat year over year, down 0.3%. Homes sold for 95% of list on average, the lowest ratio among the areas covered here, so pricing strategy matters for sellers.
Milton
Milton recorded 128 sales at an average of $966,412 (median $888,500). The benchmark is down 4.4% year over year to $870,000. Inventory is relatively tight at 3.9 months.
Burlington
Burlington stood out this month. It recorded 214 sales at an average of $1,046,822 (median $892,000), and its benchmark price of $850,800 is up 0.3% year over year, the only area in this update with a year-over-year gain. Burlington also has the highest sales-to-new-listings ratio of the group at 46.7% and 3.6 months of inventory.
York Region
York Region posted 1,038 sales at an average of $1,142,789 (median $1,050,000). Its benchmark price fell 6.8% year over year to $1,071,700, the largest decline among the areas covered here. With 5.0 months of inventory, York currently offers buyers the most choice and the strongest negotiating position in this group.
Durham Region
Durham recorded 589 sales at an average of $793,024 (median $740,000), the most affordable of the areas covered. The benchmark is down 5.1% year over year to $798,100. Durham also moved fastest, at 29 days on market on average, with 3.6 months of inventory and an average sale-to-list ratio of 98%.
What this means if you are moving up
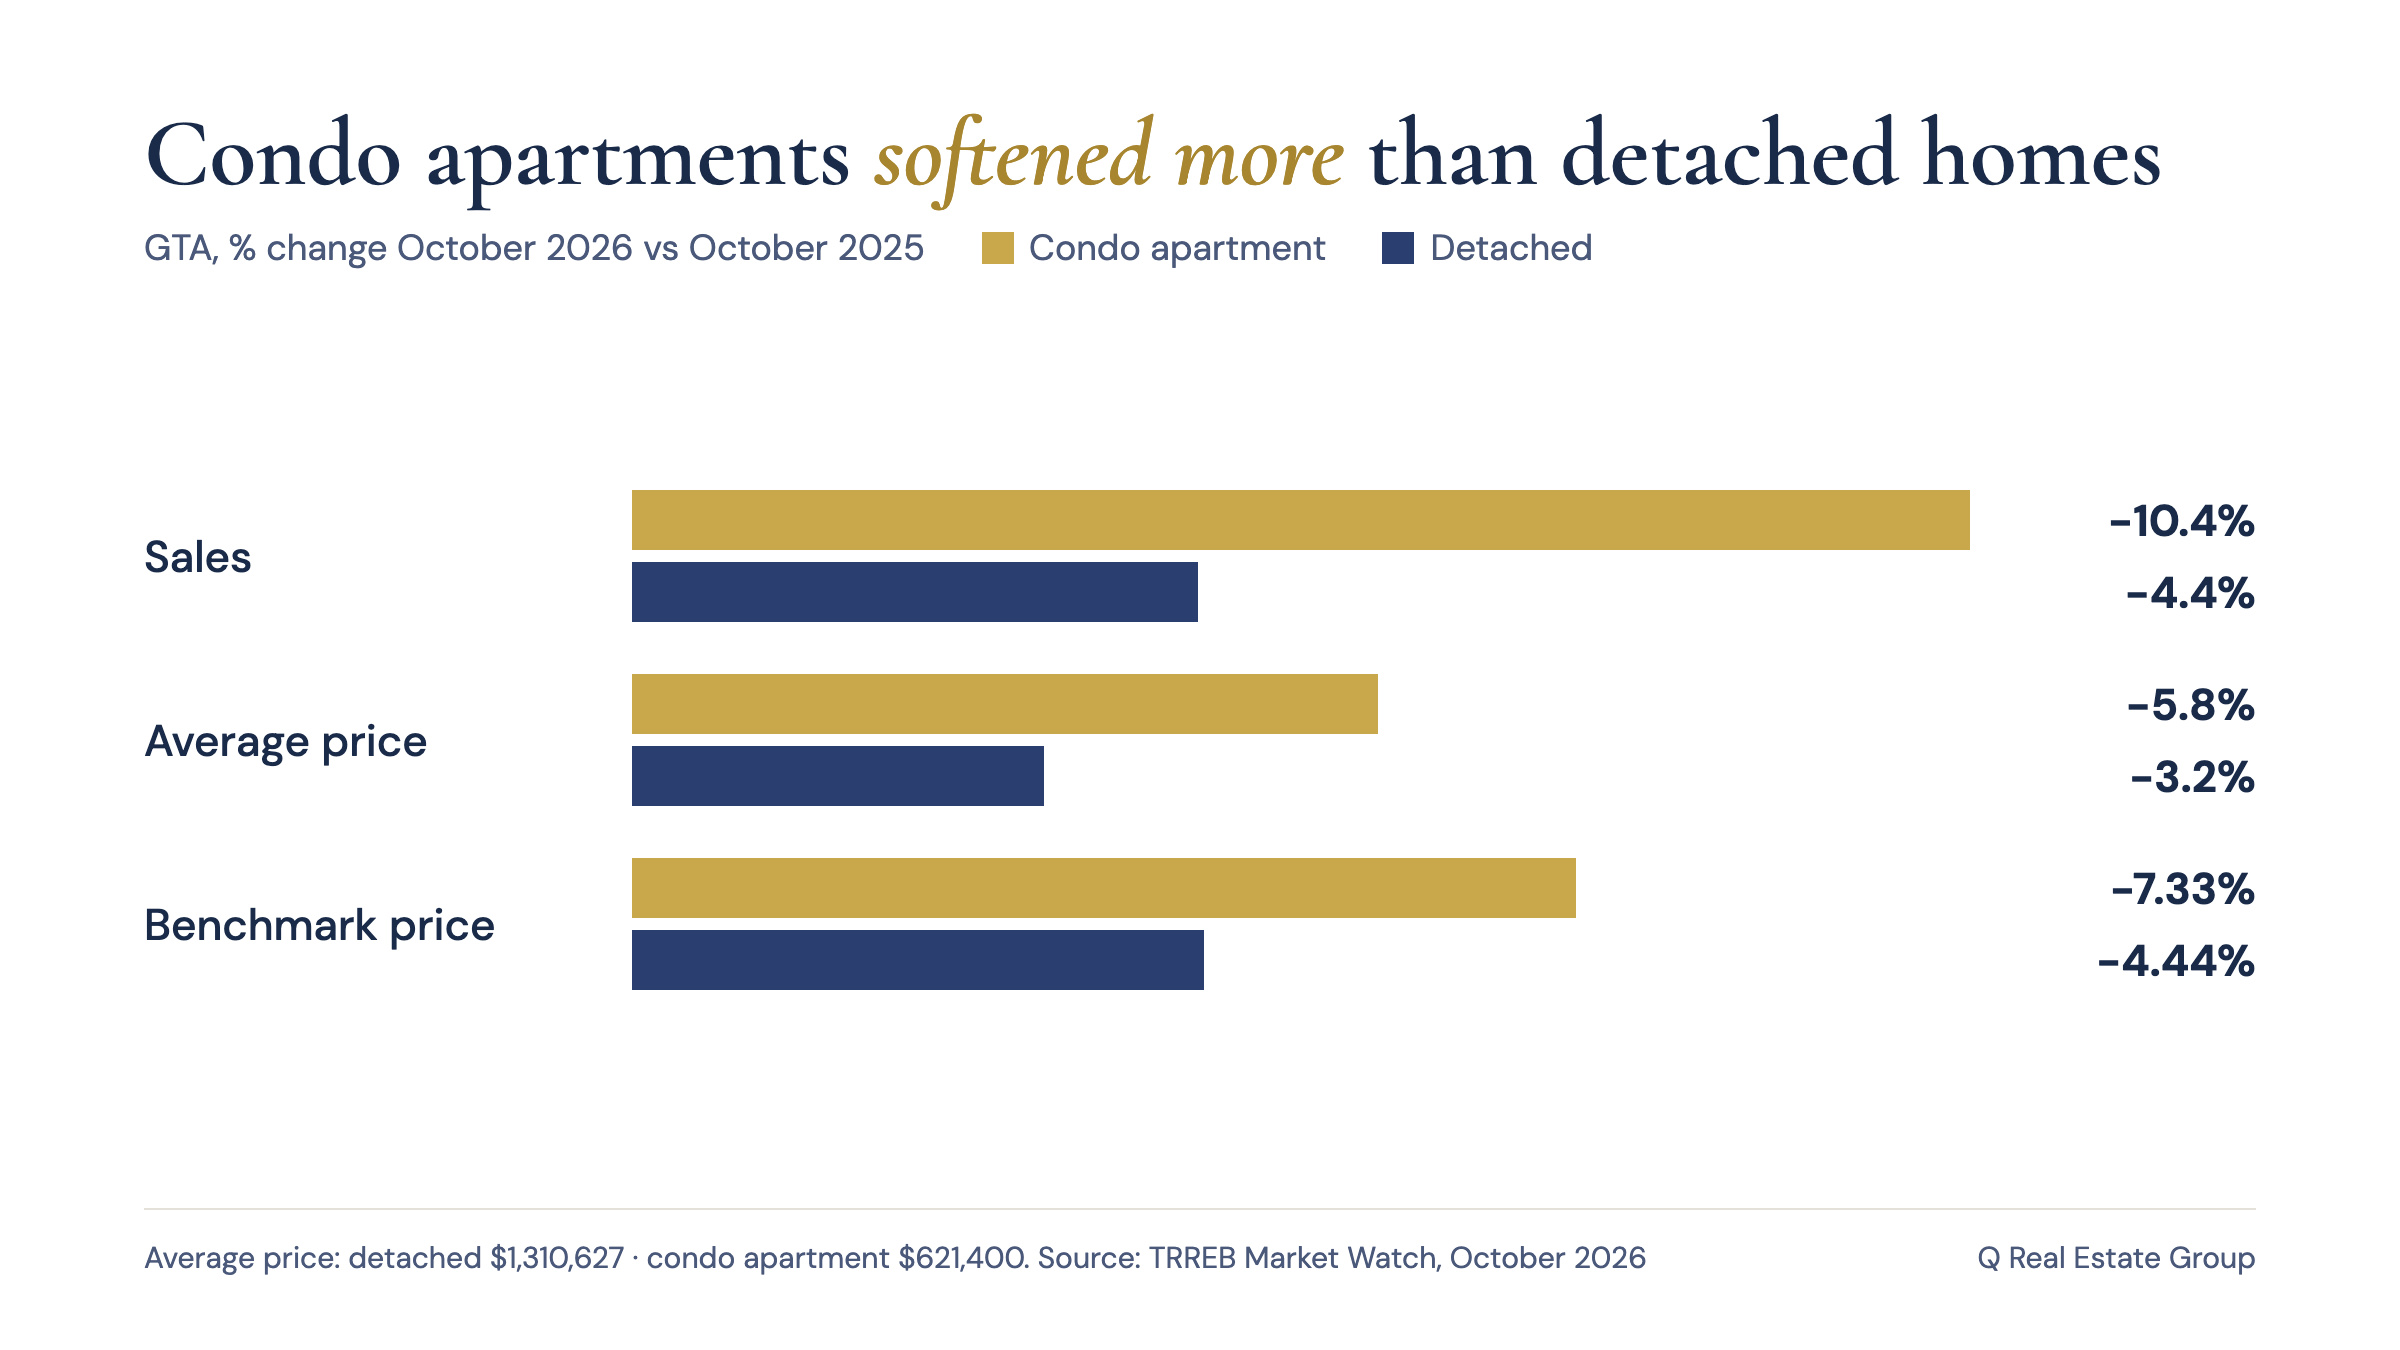
Across the GTA, condo apartment prices fell further than detached prices over the past year. The apartment benchmark is down 7.3% year over year, compared with 4.4% for detached homes. For condo owners planning to move up, that means your sale may bring in a little less, but the home you buy is also priced below last year. The difference between the two is what matters most, and it varies by neighbourhood.
What this means for buyers and sellers
For buyers, October offered choice and room to negotiate, especially in York Region, Mississauga and Oakville. For sellers, accurate pricing is essential: homes are selling, but mostly below list. Burlington, Durham and Milton are currently the tighter markets, where well-priced homes are moving more quickly.
If you would like to see what these numbers mean for your neighbourhood or price range, I am happy to walk you through it. Reach Quynh Tran at 416-897-0778 or [email protected].
Source: Toronto Regional Real Estate Board, Market Watch, October 2026.
FAQ
Are GTA home prices going down in October 2026? Yes, modestly. The GTA average selling price was $1,024,108 in October 2026, down 2.7% from October 2025, and the MLS HPI composite benchmark was down 4.3%. On a seasonally adjusted basis, prices edged up from September.
Is it a buyer's or seller's market in the GTA right now? Conditions favour buyers in most areas. The GTA had 4.6 months of inventory and homes sold for 97% of list price on average. Burlington, Durham and Milton were tighter, with under four months of inventory.
Which GTA area had the biggest price decline in October 2026? Among Toronto, Mississauga, Oakville, Milton, Burlington, York Region and Durham Region, York Region had the largest year-over-year benchmark decline at 6.8%.
Did any GTA area see prices rise year over year? Burlington's benchmark price rose 0.3% year over year to $850,800, the only gain among the areas in this update.
How long are homes taking to sell in the GTA? Homes sold in an average of 31 days on market in October 2026. Durham was fastest at 29 days and Oakville slowest at 37 days among the areas covered.