
August 2026 GTA Market Update | Q Real Estate Group
The GTA average home price sat at $993,410 in August 2026, down 2.7 percent from a year earlier, as active listings fell 11.3 percent and pulled back faster than sales. Year to date, the average sale price across all TRREB areas is $1,027,505, down 4.8 percent from the same point in 2025. Fewer homes came to market in August, and that tighter supply is the story to watch heading into fall.
The August 2026 numbers at a glance
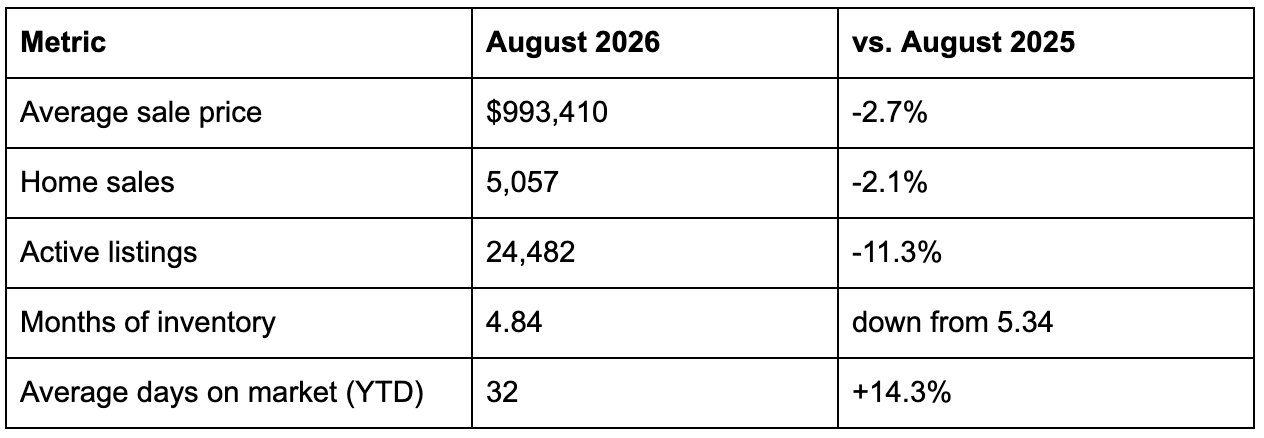
Takeaway: Listings are disappearing faster than sales are, which is why months of inventory dropped even though fewer homes changed hands than a year ago. That's a supply story, not a demand surge — and it's worth watching, because a tighter market is often the setup for renewed price pressure.
Why inventory tightened in August
Active listings across the GTA fell to 24,482 in August, down 11.3 percent from the 27,593 available a year earlier and down from 26,098 in July. Sales cooled seasonally too, dropping from 6,770 in June to 5,057 in August, which is the normal late-summer pattern. But listings pulled back harder than sales did, and that combination — fewer choices for buyers, without a corresponding drop in demand — is what tightened the months-of-inventory reading to 4.84, still within balanced-market territory but moving in a direction worth watching.
Year to date, 114,649 new listings have come to market across the GTA, down from 134,963 over the same period in 2025. Total year-to-date sales, meanwhile, are essentially flat at 42,120, up just 0.1 percent from last year's 42,059. Buyers haven't disappeared. Sellers have been more hesitant to list.
Area-by-area breakdown
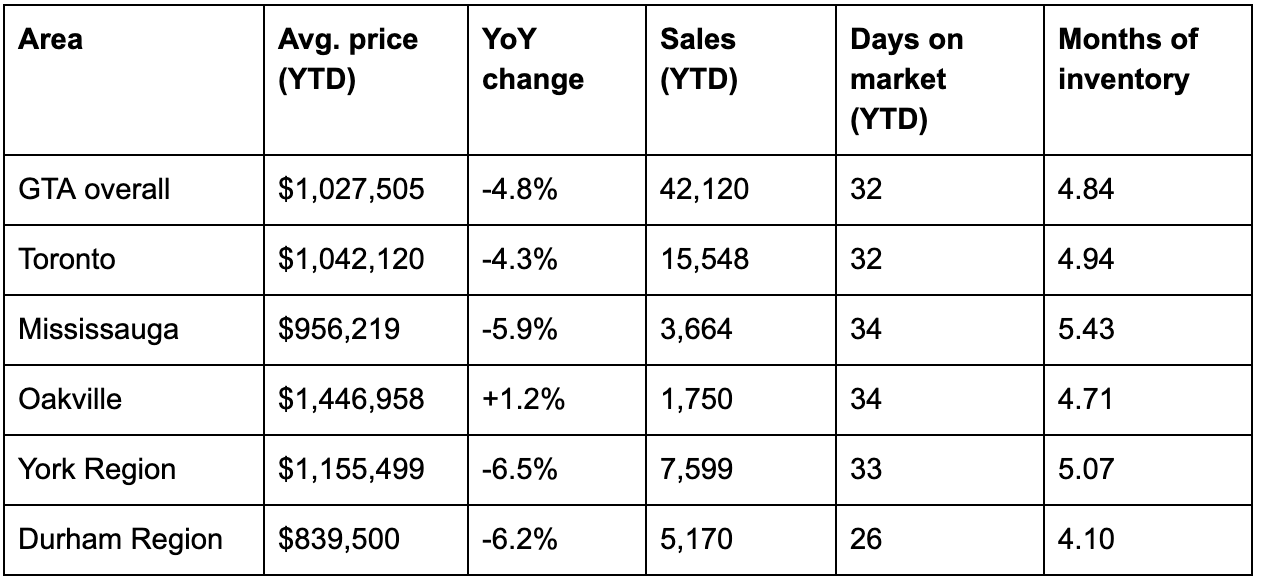
Conditions varied meaningfully by market in August. Here's how the GTA's major sub-markets stacked up on a year-to-date basis.
Toronto
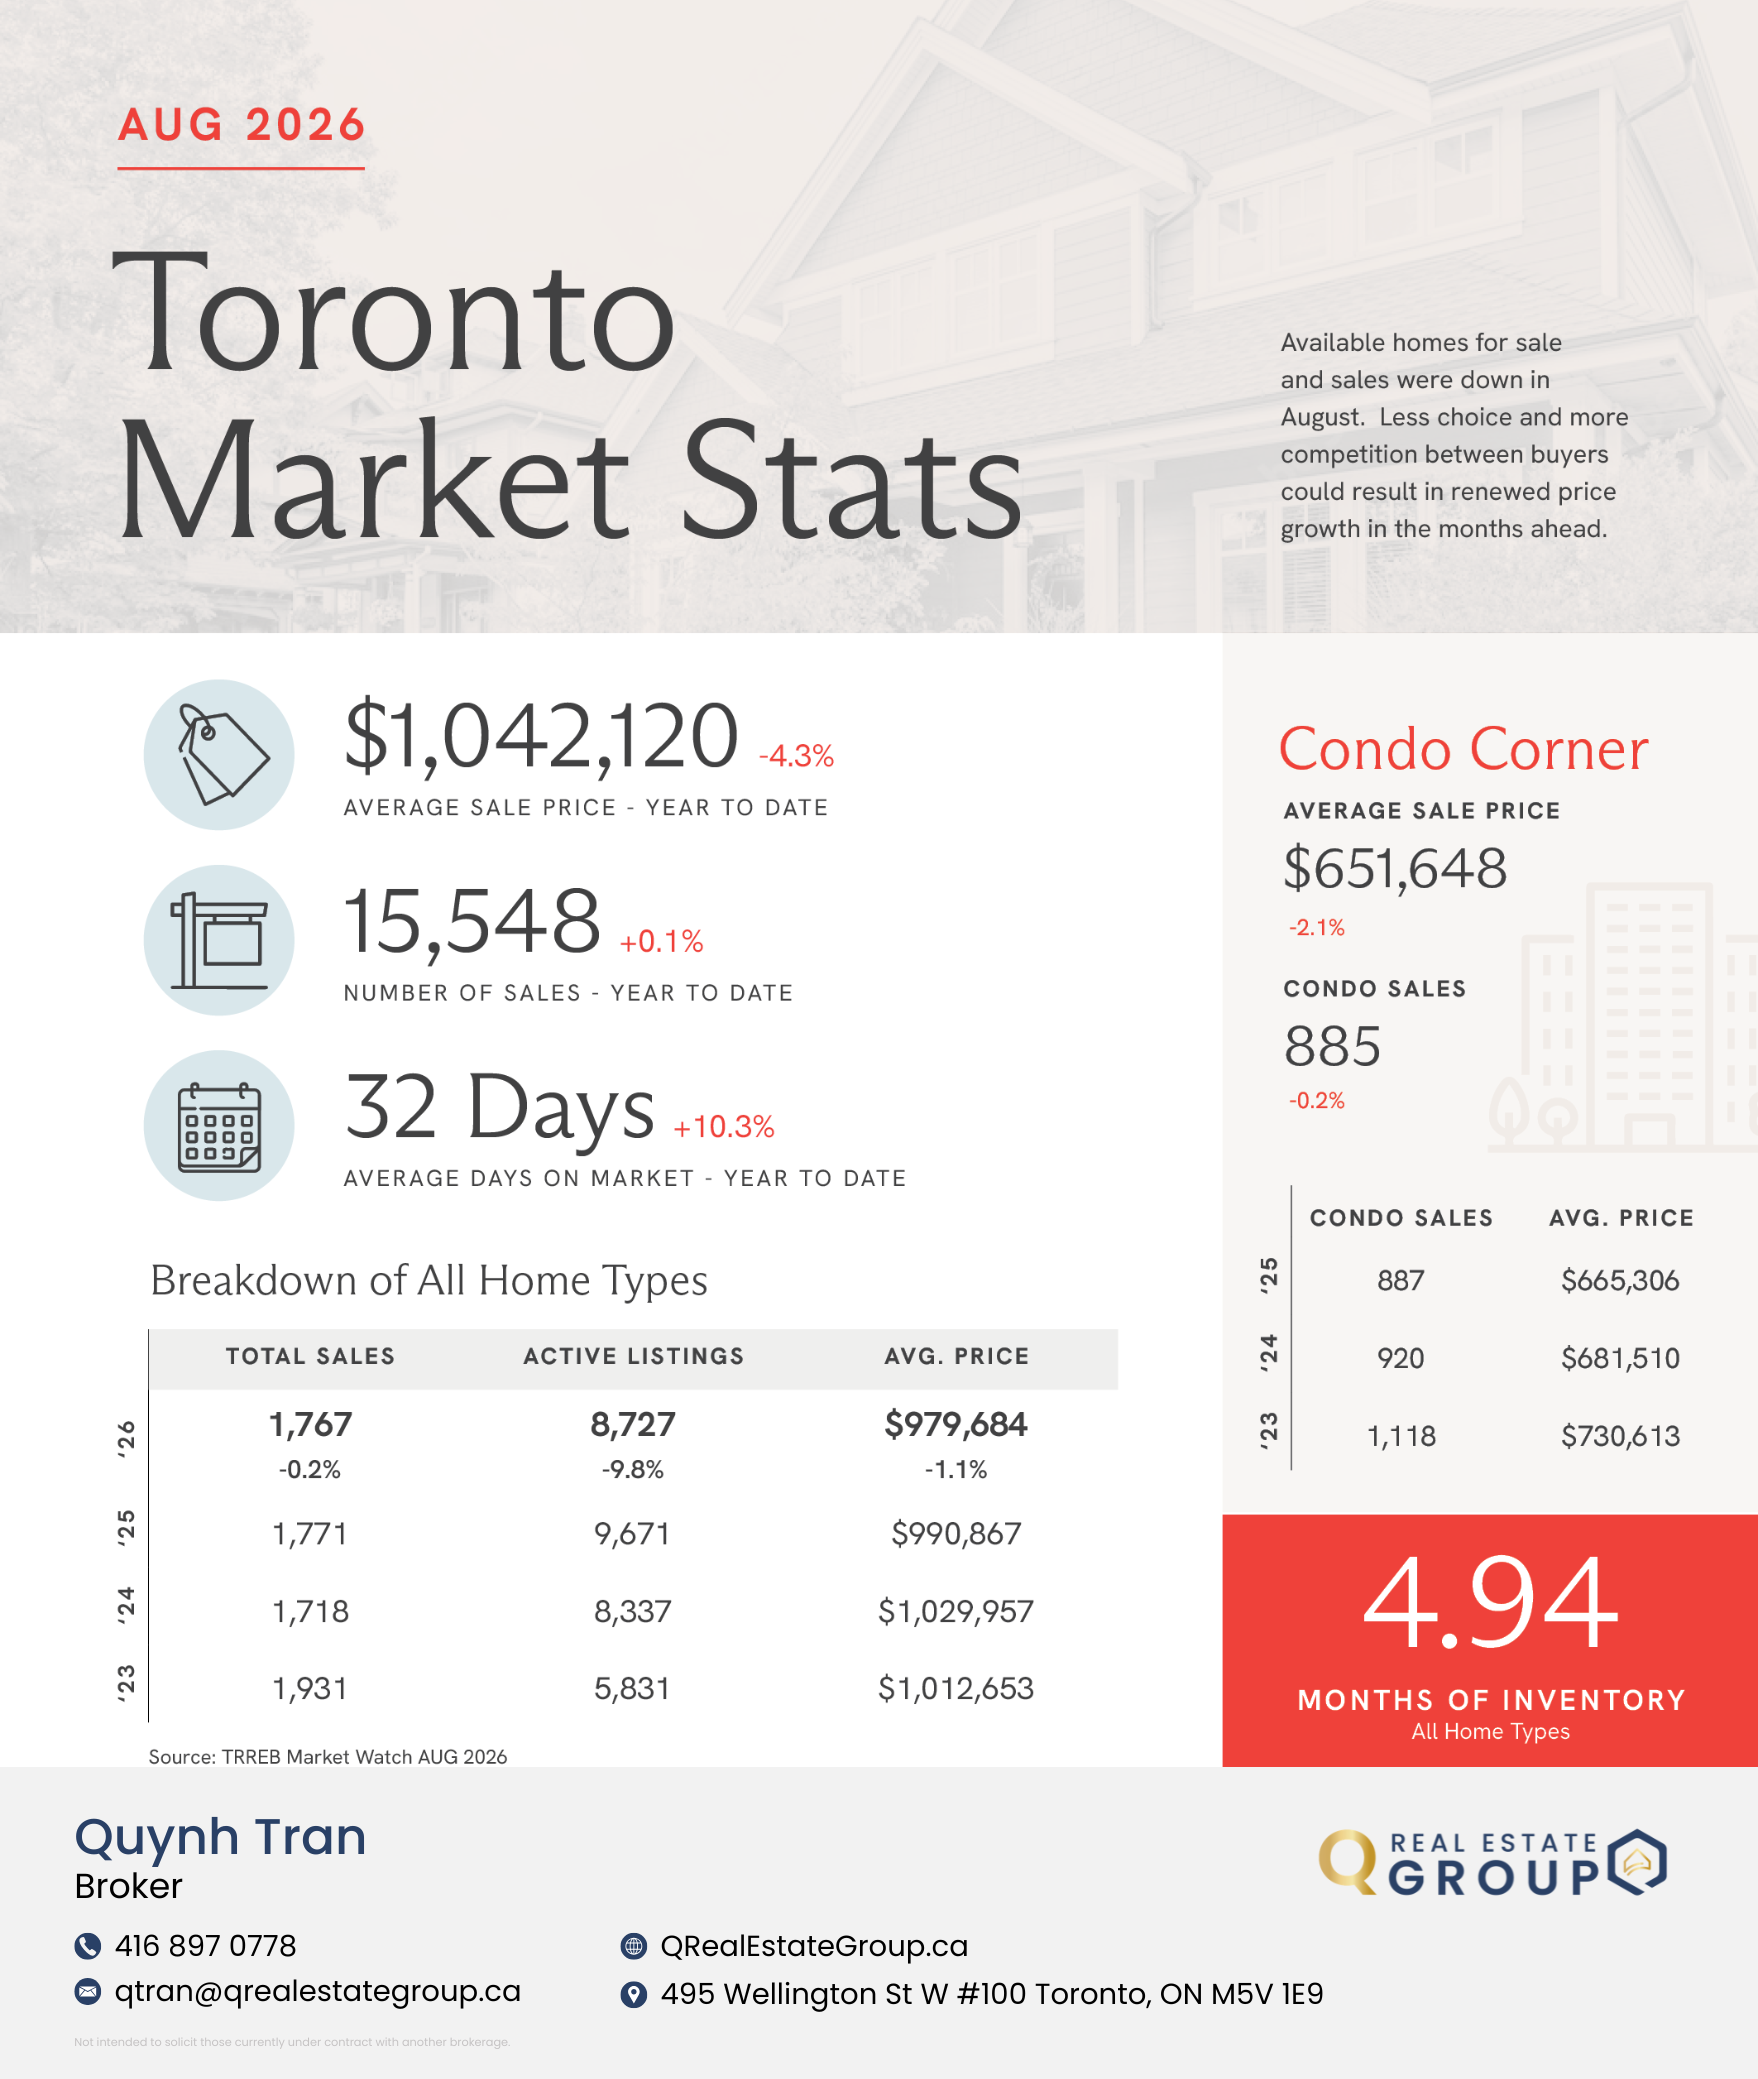
Toronto's average sale price came in at $1,042,120 year to date, down 4.3 percent from last year. August alone saw 1,767 sales, down slightly from 1,771 a year earlier, against 8,727 active listings, down 9.8 percent. At $979,684, Toronto's August average price was down 1.1 percent year over year, and months of inventory sat at 4.94.
Mississauga
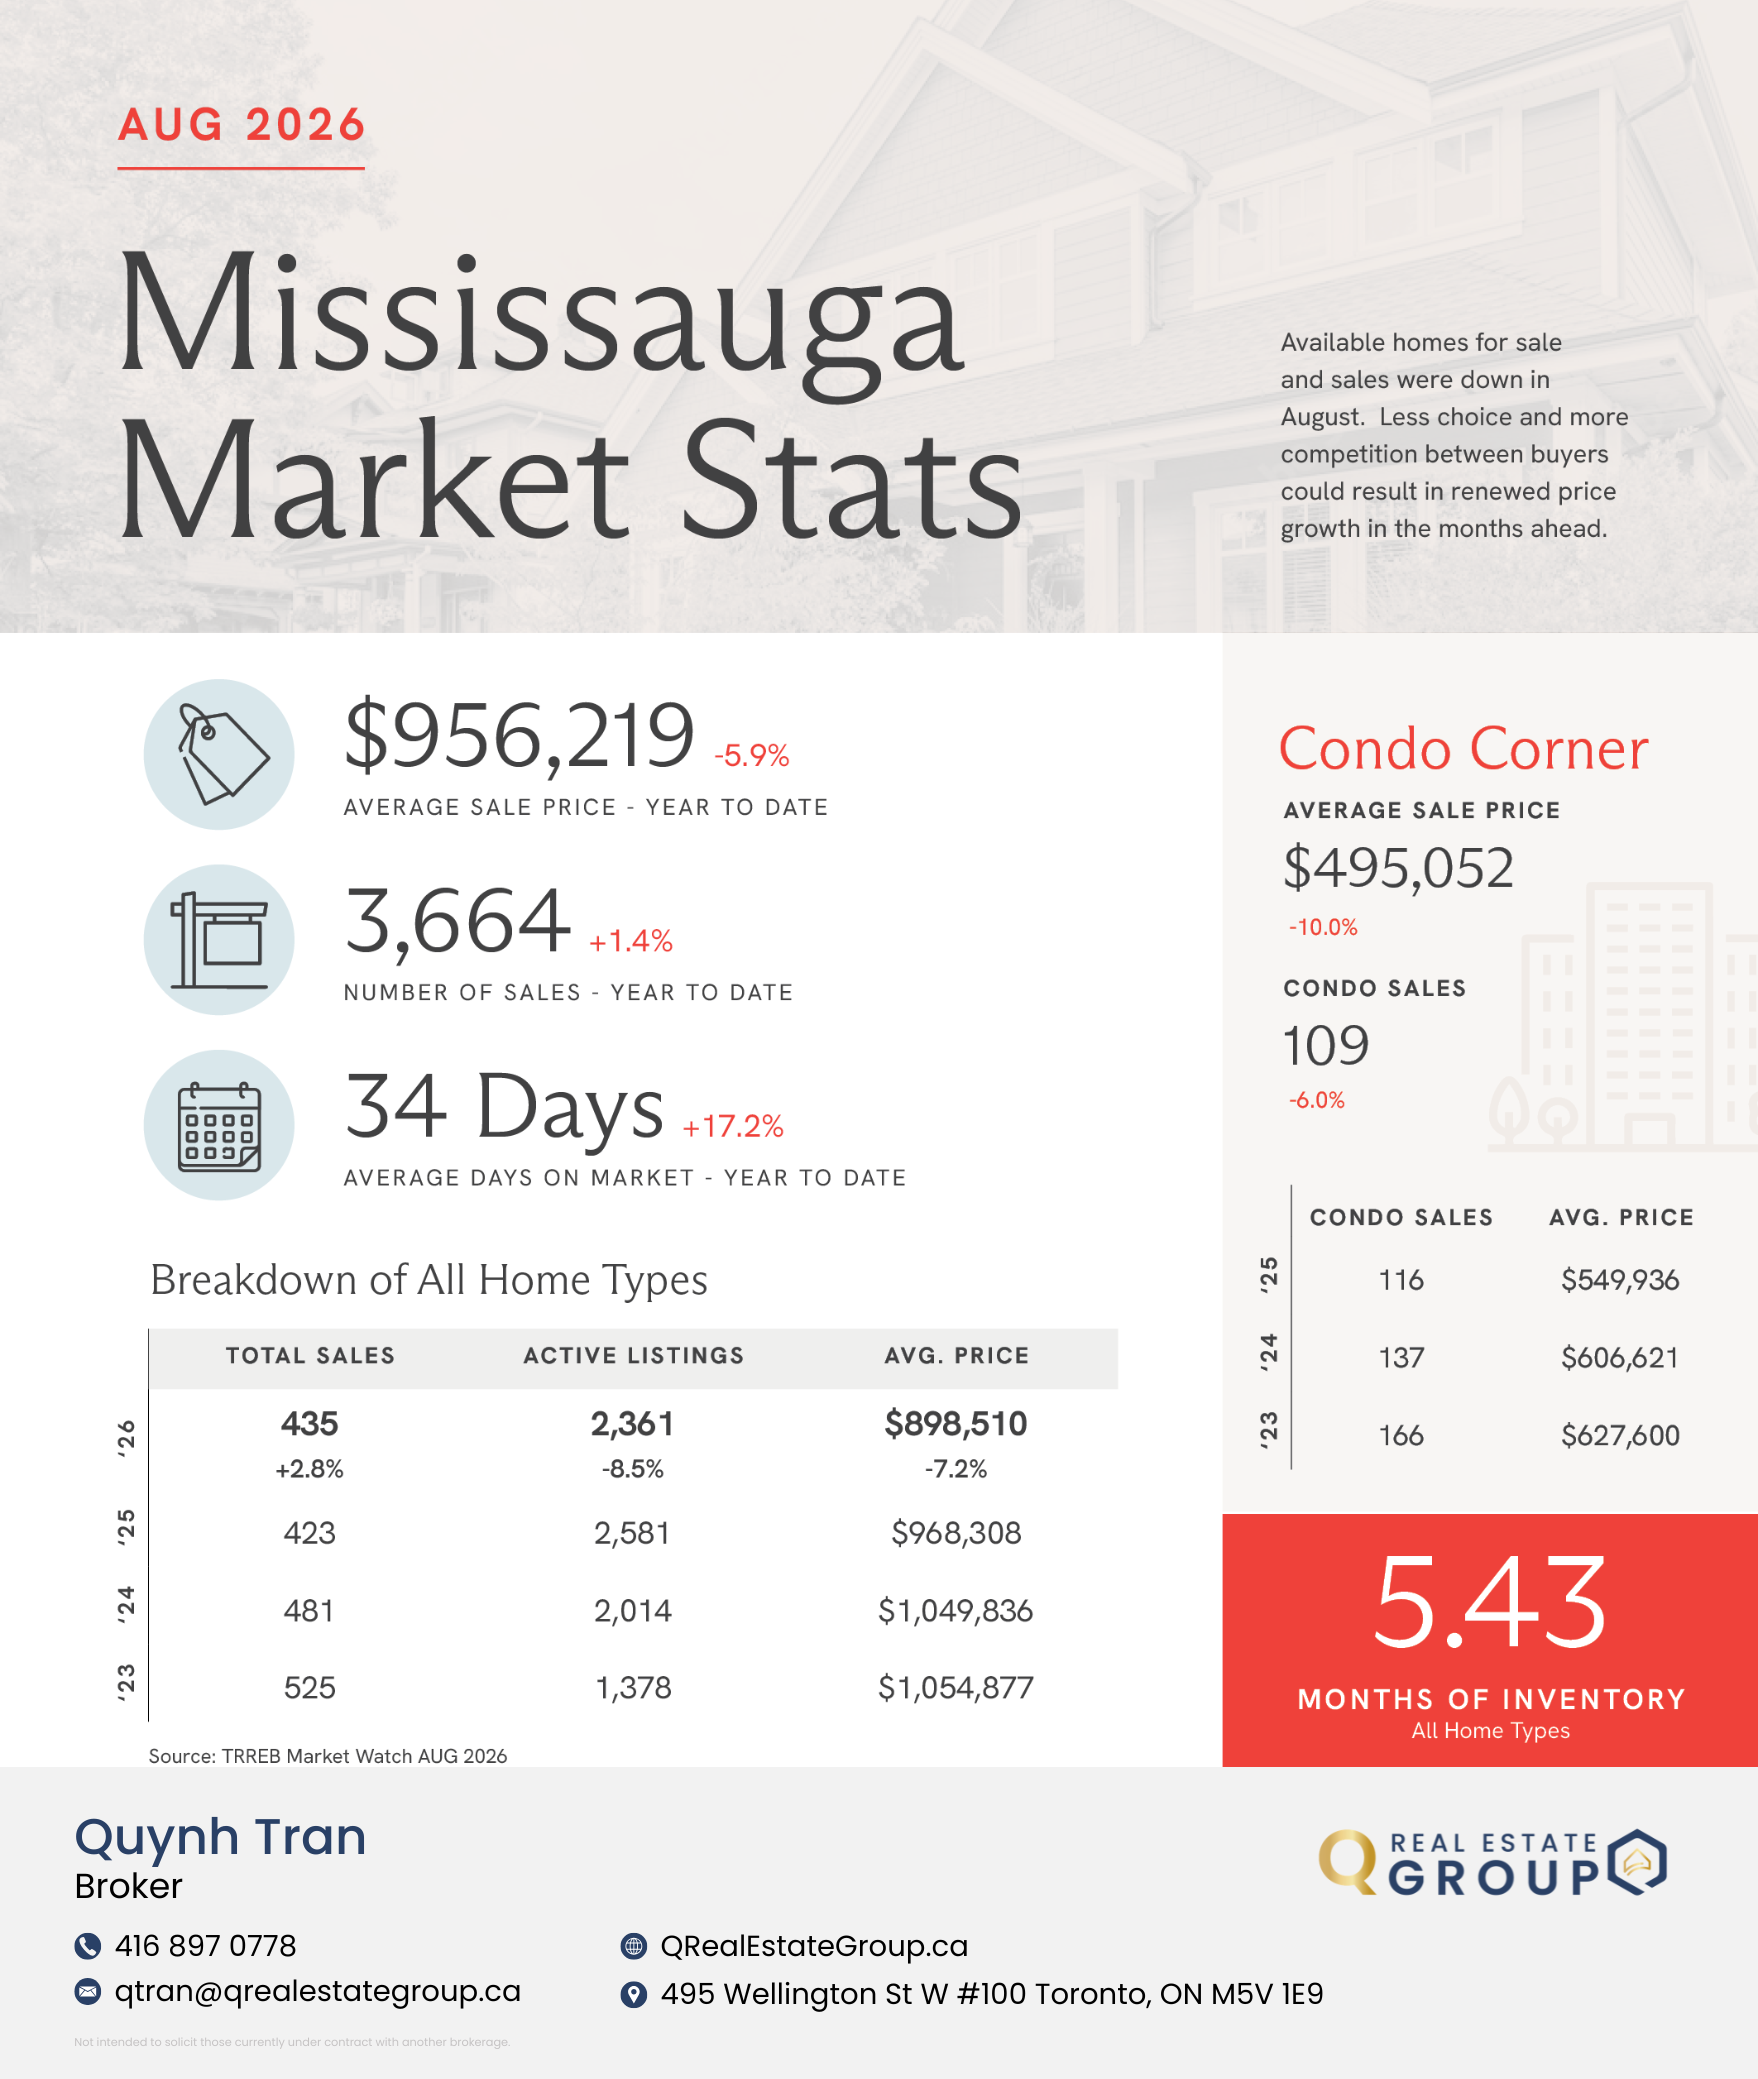
Mississauga posted the softest price performance of the major sub-markets, with the year-to-date average down 5.9 percent to $956,219. August sales actually rose 2.8 percent to 435, but active listings fell 8.5 percent to 2,361 and the average August price dropped 7.2 percent to $898,510. Mississauga's 5.43 months of inventory is the highest of the areas covered here, and its condo segment saw the steepest average-price decline in the GTA, down 10.0 percent year over year to $495,052.
Oakville
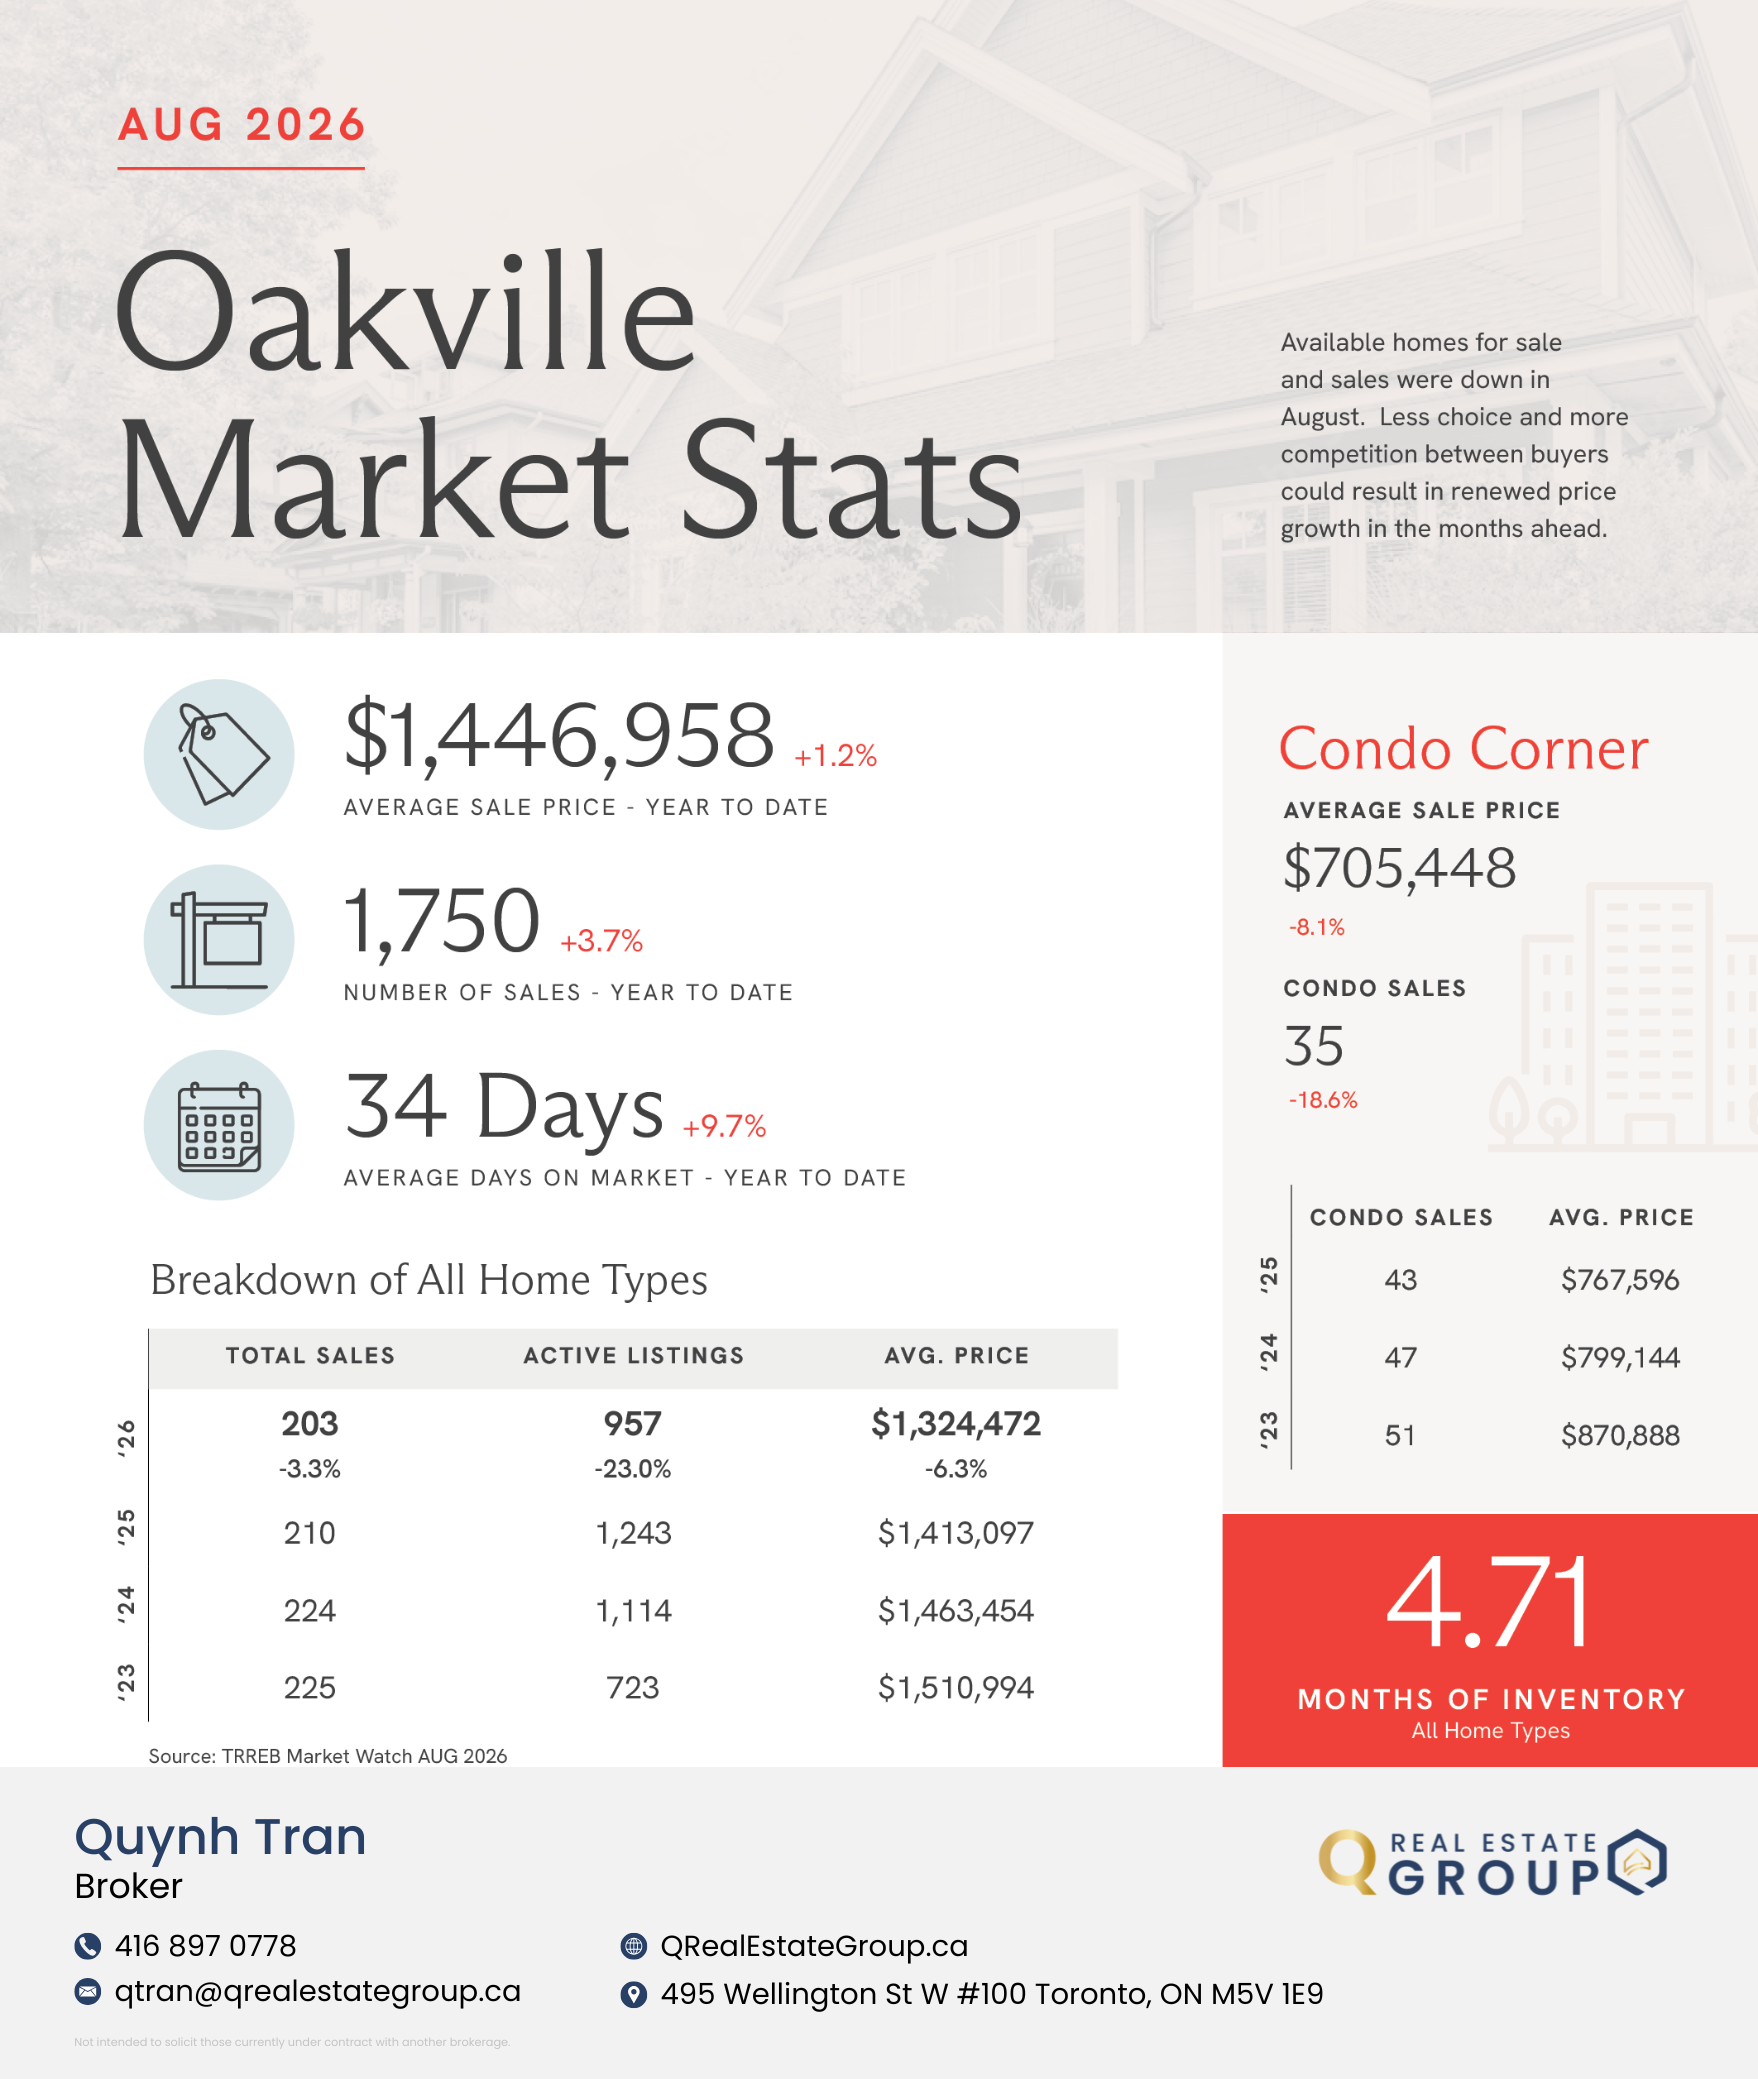
Oakville was the one market that bucked the broader trend, with its year-to-date average price up 1.2 percent to $1,446,958 and sales up 3.7 percent to 1,750. Active listings, however, fell sharply, down 23.0 percent to 957 in August — the steepest listings decline of any area in this report. That combination of rising sales and shrinking inventory pushed Oakville's months of inventory down to 4.71.
York Region
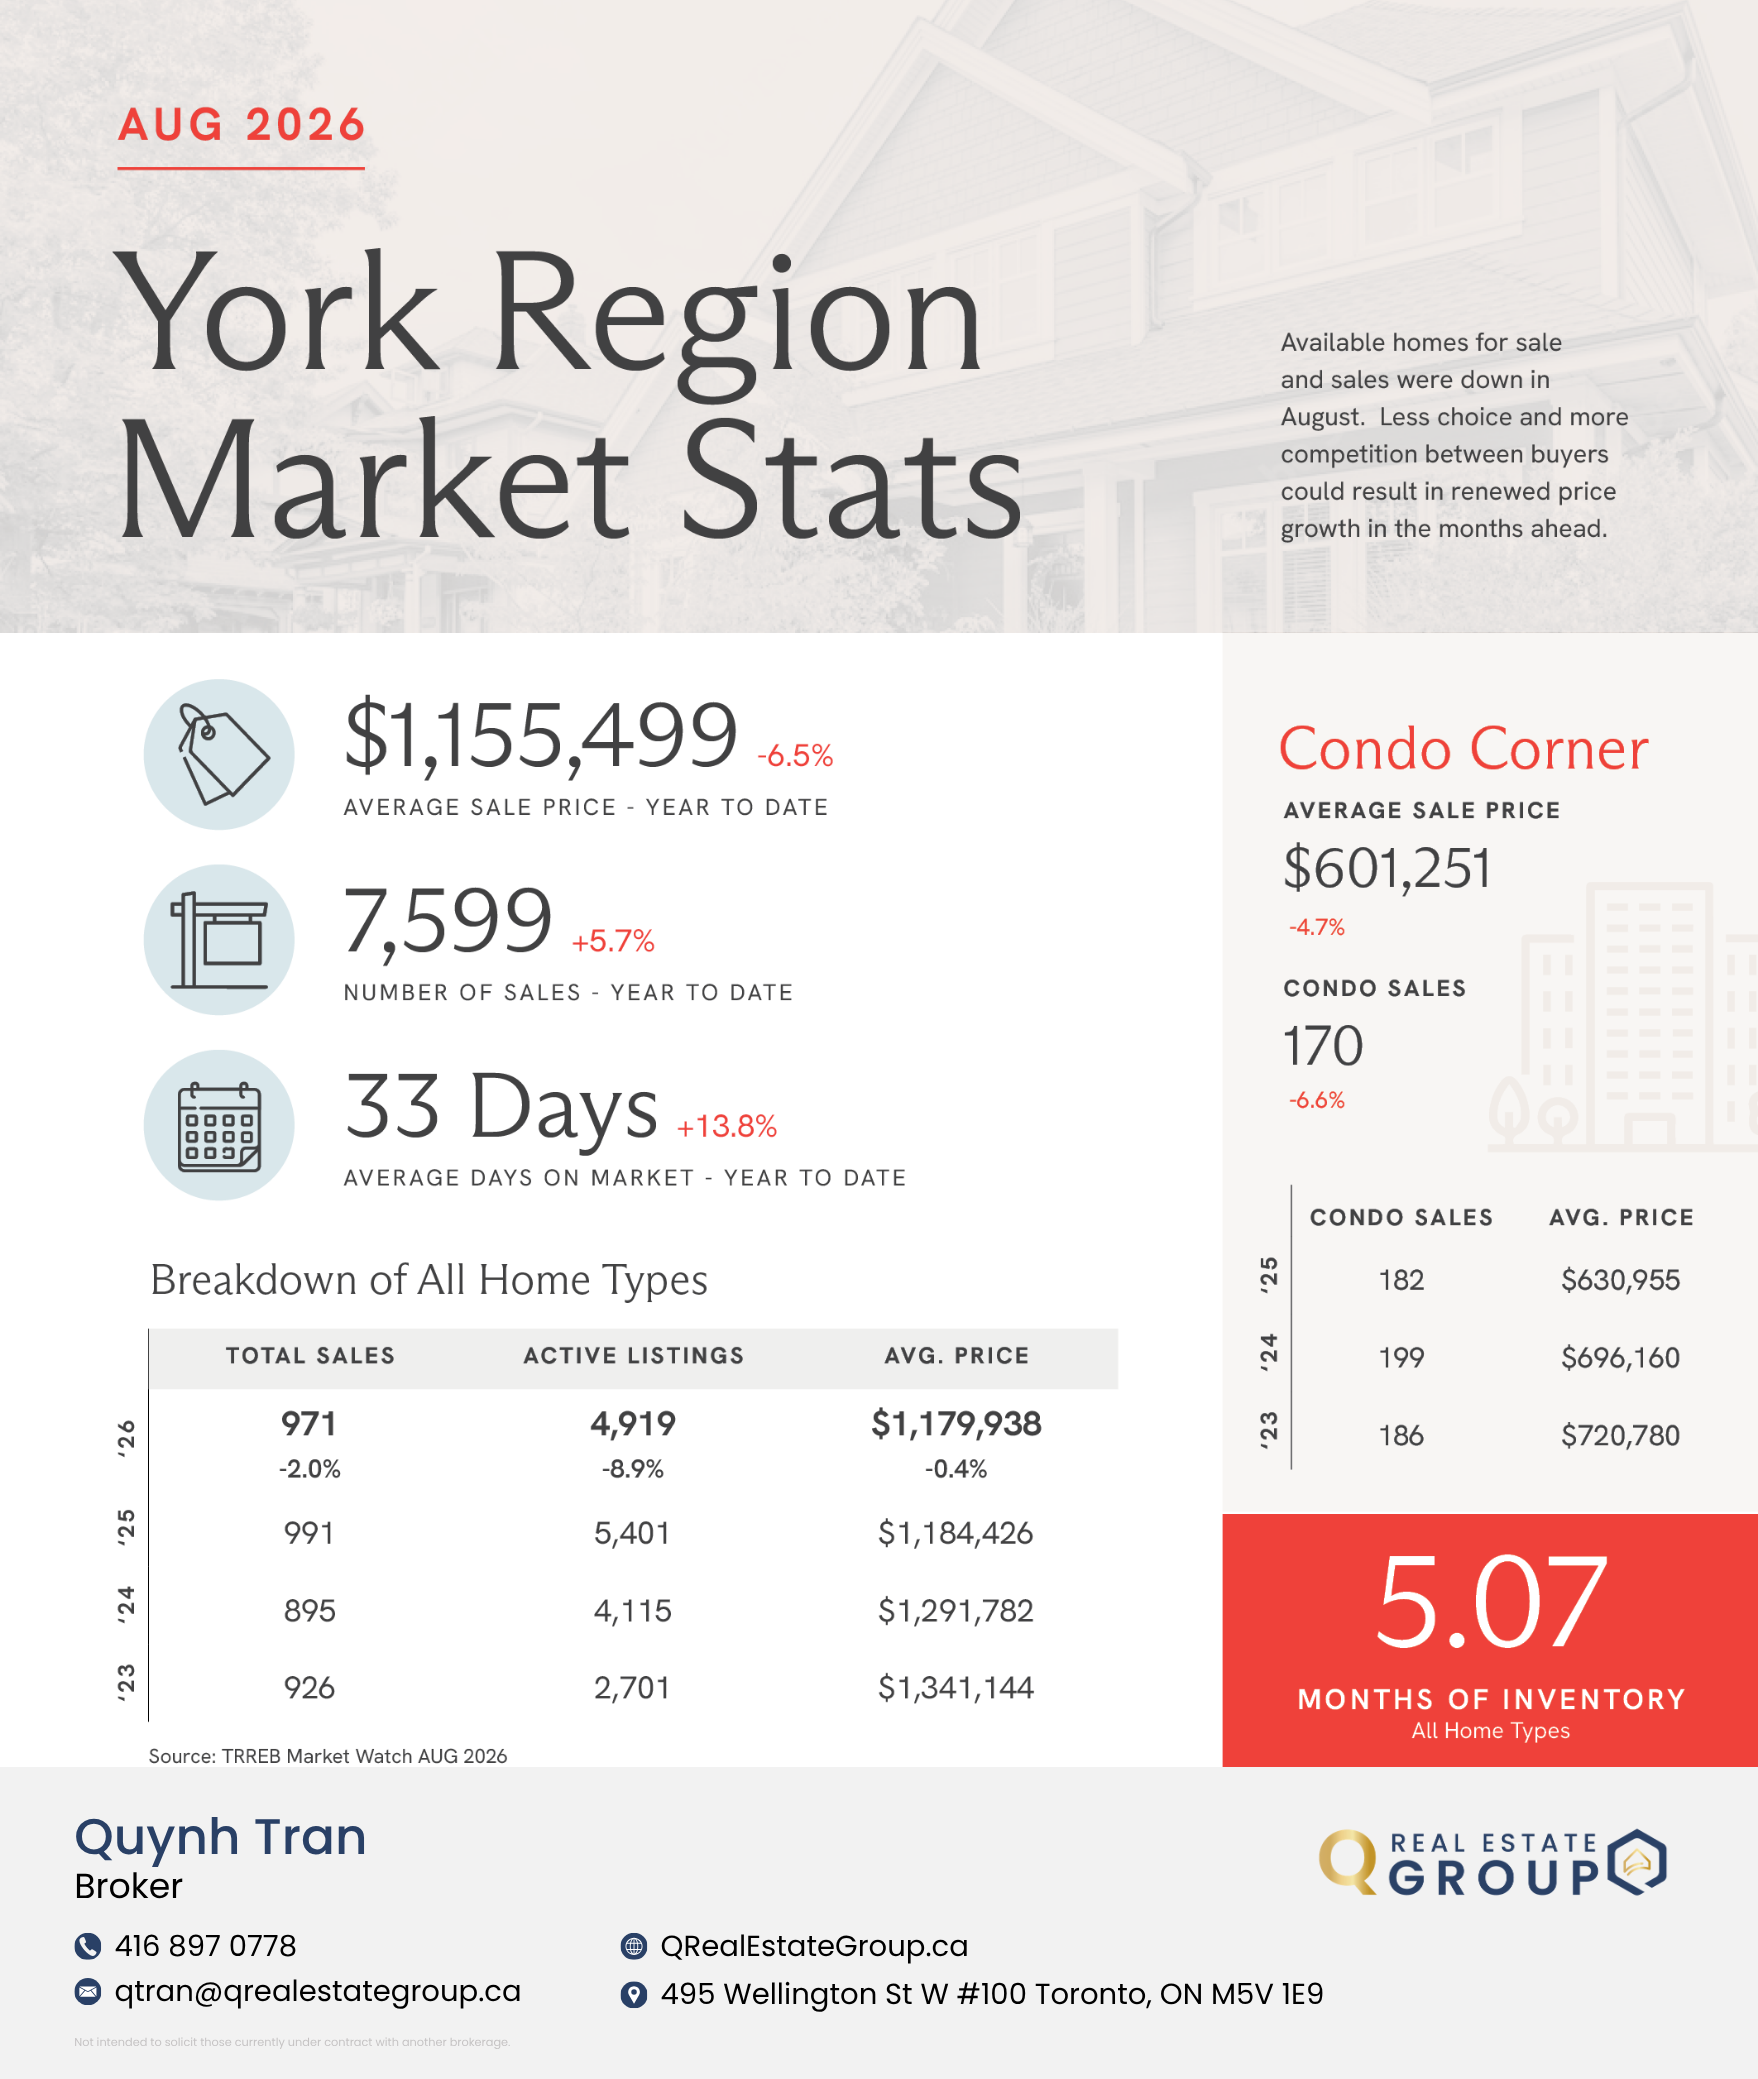
York Region recorded the largest year-to-date price decline among the major sub-markets, down 6.5 percent to $1,155,499, even as sales rose 5.7 percent to 7,599 — the strongest sales growth in the region. August listings were down 8.9 percent to 4,919, and months of inventory stood at 5.07.
Durham Region
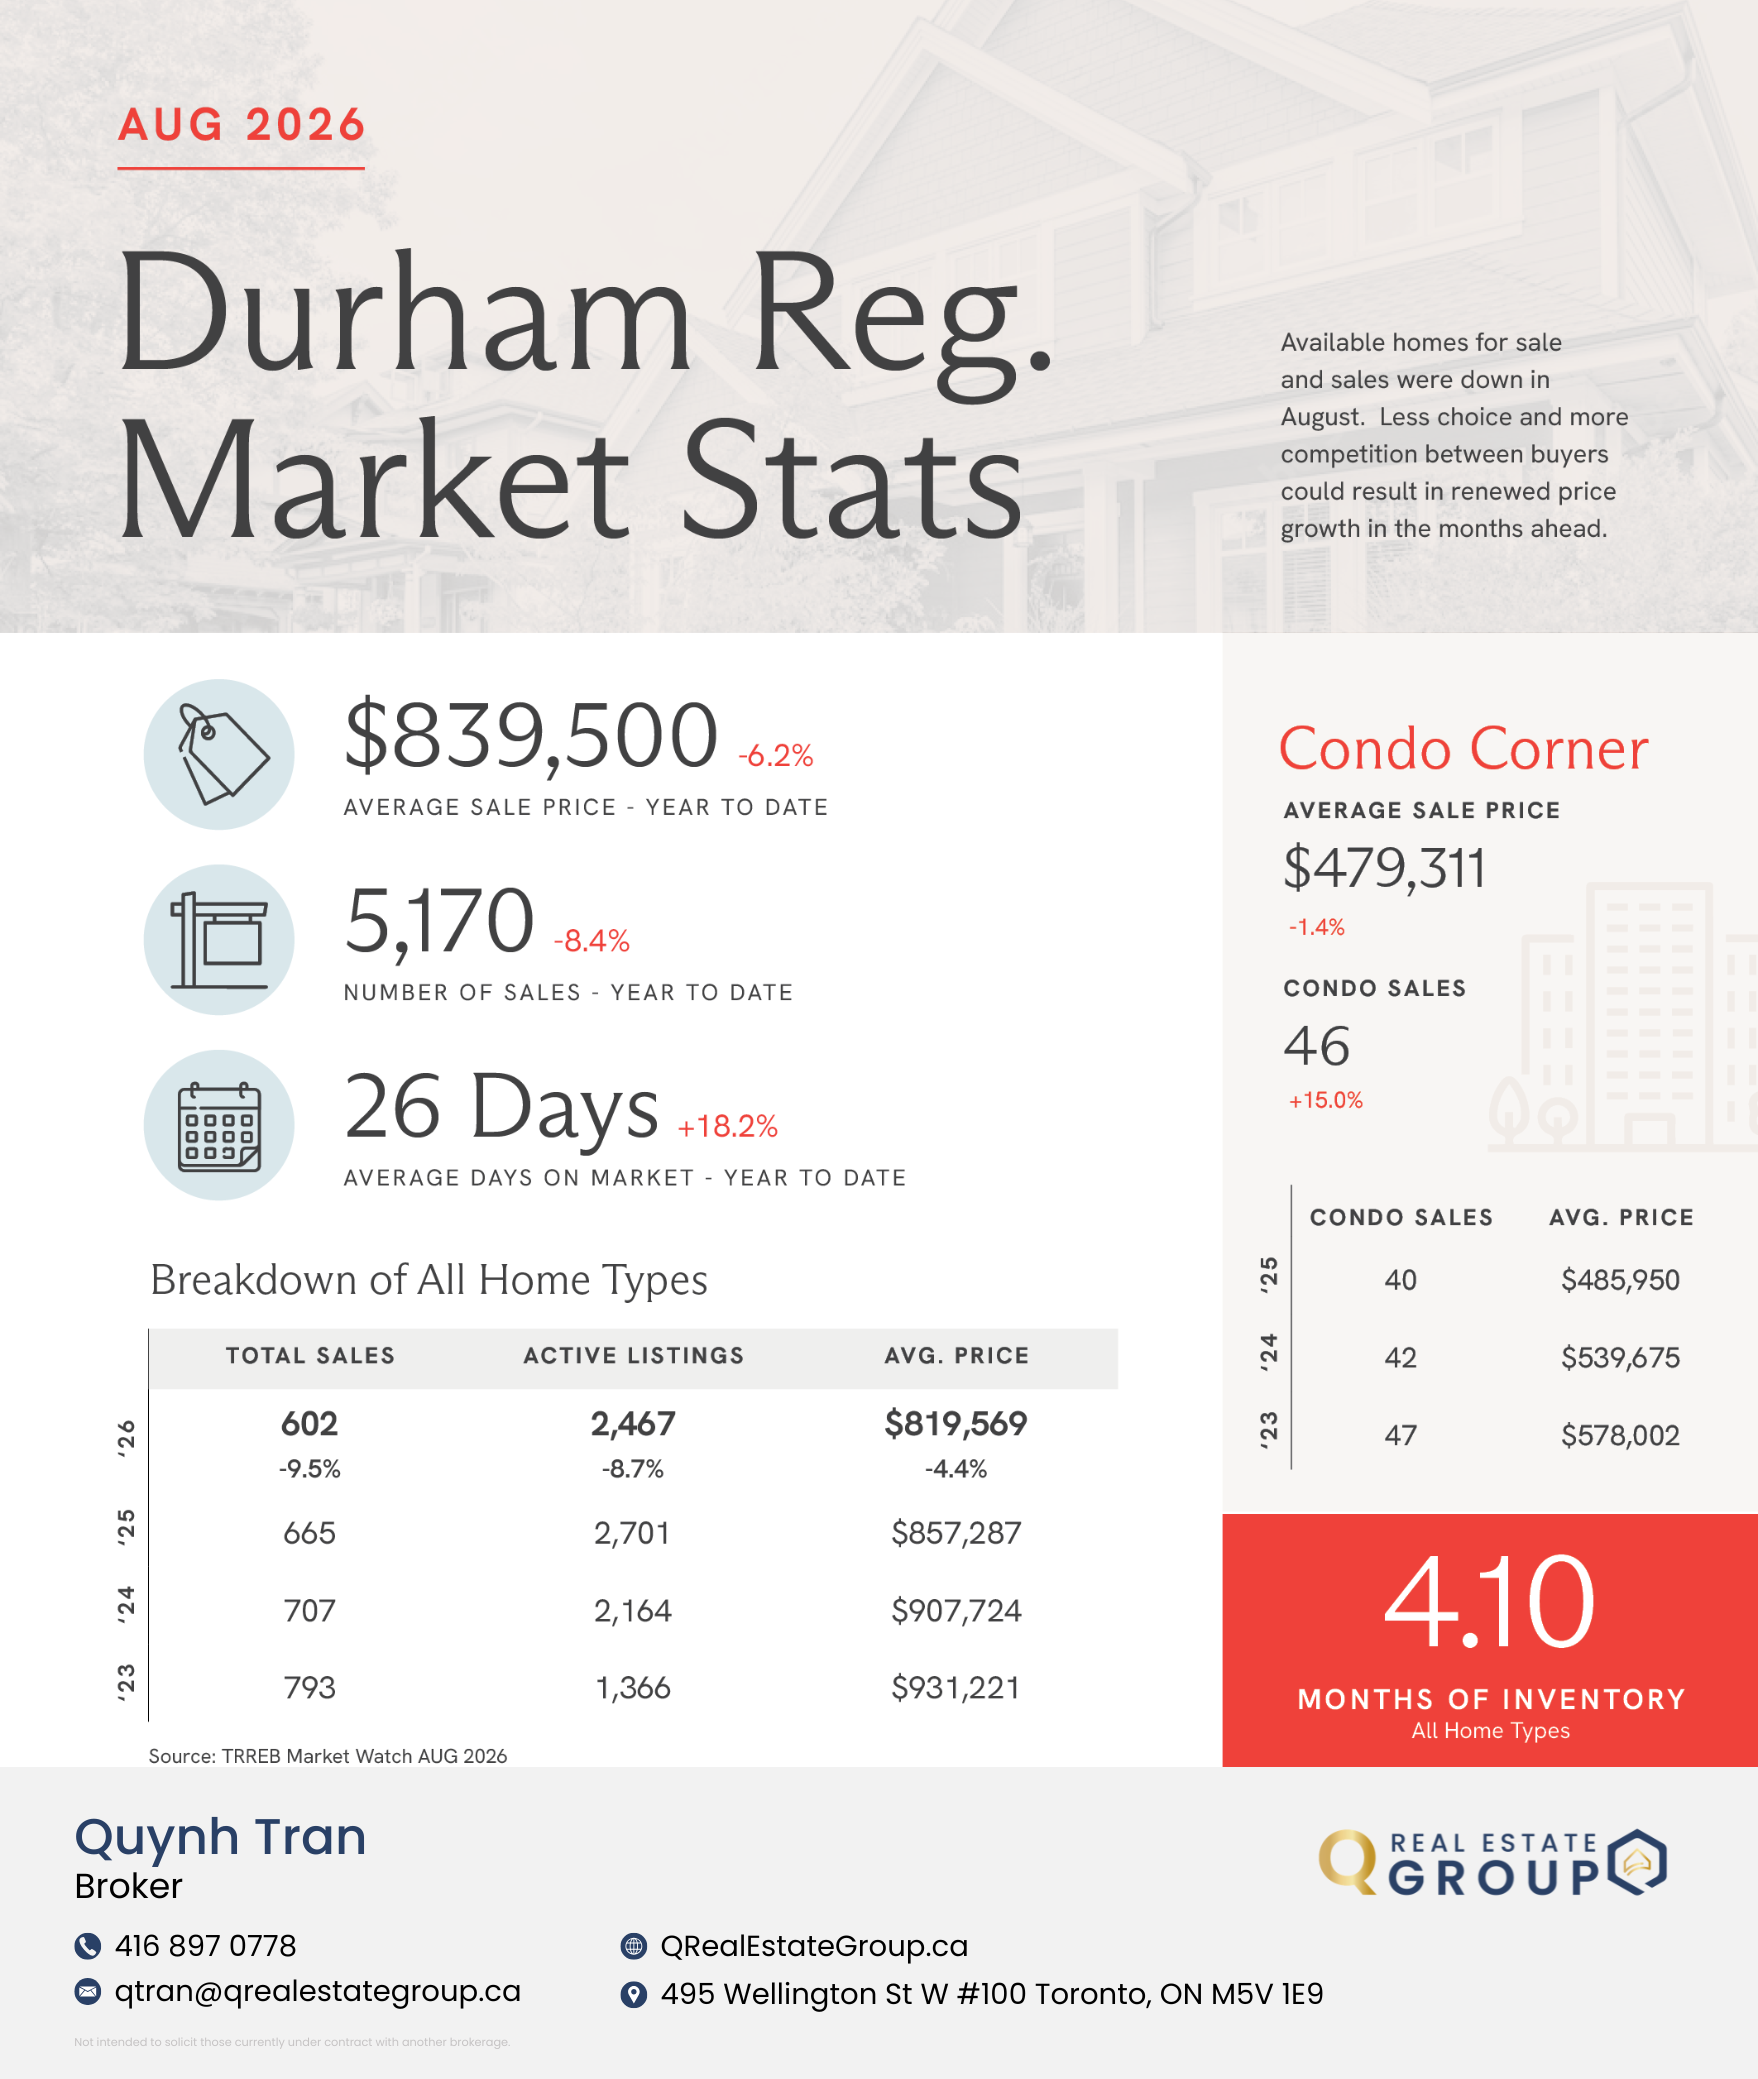
Durham Region was the outlier on the sales side, with year-to-date sales down 8.4 percent to 5,170, the only major sub-market to post a sales decline. Its average price was down 6.2 percent year to date to $839,500. On the upside for buyers, Durham posted the fastest average days on market of any area at 26 days, and its condo segment was the only one in this report to see sales growth, up 15.0 percent to 46 units in August.
The condo market
Condo pricing softened across the GTA in August. The average condo sale price across all TRREB areas was $617,593, down 3.6 percent year over year, on 1,330 sales, down 2.6 percent. Every sub-market covered here saw condo prices fall year over year, with Mississauga posting the steepest decline (down 10.0 percent to $495,052) and Durham Region the shallowest (down 1.4 percent to $479,311). Durham was also the only market with condo sales growth, up 15.0 percent to 46 units, while Oakville saw the sharpest pullback in condo sales volume, down 18.6 percent to 35 units alongside an 8.1 percent price decline to $705,448.
Where interest rates fit in
The Bank of Canada overnight rate has held at 2.25 percent through much of 2026, a marked retreat from the 5.00 percent peak reached during 2023 and held into 2024 — the fastest tightening cycle in modern Canadian history, which took the rate from 1.5 to 4.5 percent in six months. Rate cuts that began in late 2024 helped the market find its footing through 2025. But lower borrowing costs alone haven't been enough to reignite price growth in most GTA sub-markets: average prices are still below year-ago levels almost everywhere in this report, even with the overnight rate near its lowest point since early 2023.
What this means for buyers
Fewer new listings mean less selection, but it also means less competition from other sellers pricing against you if you're weighing when to sell and buy in the same market. With months of inventory still in balanced territory across most areas (4.10 to 5.43), buyers generally retain room to negotiate on price and conditions, particularly in Mississauga and York Region, where inventory is running highest relative to sales. If you've been waiting for pricing to soften further, several markets — Mississauga, York Region and Durham Region among them — are already down more than 5 percent year to date.
What this means for sellers
A tighter listings environment can work in your favour if you're pricing realistically: less competition from other sellers is one of the more useful positioning points in this market. That said, days on market are up across every area covered here, between 9.7 and 18.2 percent year over year, so pricing at or near current market value matters more than it did a year ago. Oakville's combination of rising prices and shrinking inventory makes it the strongest seller's position of the six markets in this report; Mississauga and Durham Region, where prices fell furthest, call for a more conservative pricing strategy.
Frequently asked questions
What was the average GTA home price in August 2026? The average GTA home price in August 2026 was $993,410, down 2.7 percent from August 2025. Year to date, the average sale price across all TRREB areas sits at $1,027,505, down 4.8 percent from the same point last year.
Are home prices dropping in the GTA? Most GTA sub-markets saw prices soften year over year in August 2026. Toronto, Mississauga, York Region and Durham Region were all down on a year-to-date average price basis, while Oakville was the exception, up 1.2 percent year to date.
How many months of housing inventory does the GTA have? The GTA had 4.84 months of inventory in August 2026 across all home types, down from 5.34 months a year earlier. A balanced market is generally considered to be in the 4 to 6 month range.
What is the Bank of Canada overnight rate doing to the housing market? The Bank of Canada overnight rate has held at 2.25 percent through much of 2026, down from a peak of 5.00 percent reached in 2023. Lower borrowing costs have not yet translated into renewed price growth, as active listings pulled back faster than sales in August 2026.
Thinking about buying or selling in this market?
Every one of the markets in this report is telling a slightly different story right now, and the right move depends on your specific price range, area and timeline. If you'd like to talk through what August's numbers mean for your plans, I'm happy to walk through the data with you.
Source: TRREB Market Watch, All TRREB Areas, August 2026.